How Do You Find Historical Property Price Trends? (England & Wales)
Find historical property price trends for any postcode in England and Wales using official sold-price records from HM Land Registry and ONS data.
Search HM Land Registry's free Price Paid Data by postcode or address to see every registered sale in England and Wales since 1995, with date, price, type and tenure. Group the sales by year, use the median and count how many sales sit behind it, then set the result against the UK House Price Index for the same council area. Scotland and Northern Ireland keep separate records.
In this post
- Table of Contents
- What Historical Property Price Trends Show You
- Using the HM Land Registry Sold Price Search
- Finding the UK House Price Index by Postcode
- How to Compare Sold Prices by Year
- Sold Prices Versus Asking Prices
- Understanding What the Data Includes and Leaves Out
- Building Your Own Price History for a Postcode
- Checking Local Context Alongside Price Trends
- Frequently Asked Questions
Quick Summary
To find historical property price trends, search HM Land Registry's Price Paid Data by postcode to see recorded sales over time. Group those sales by year, compare medians, and check the UK House Price Index for wider context. Sold prices show what buyers actually paid, so they are more reliable for trends than asking prices.
- HM Land Registry's Price Paid Data records each registered sale in England and Wales, searchable by postcode or address.
- Compare median prices rather than averages, because a few unusual sales can skew an average.
- Record the number of sales in each year, since a year with very few sales gives a weak signal.
- Sold prices show what was paid, while asking prices reflect what sellers hope to achieve.
- Use the UK House Price Index to benchmark your area against its wider council area.
Table of Contents
- What Historical Property Price Trends Show You
- Using the HM Land Registry Sold Price Search
- Finding the UK House Price Index by Postcode
- How to Compare Sold Prices by Year
- Sold Prices Versus Asking Prices
- Understanding What the Data Includes and Leaves Out
- Building Your Own Price History for a Postcode
- Checking Local Context Alongside Price Trends
- Frequently Asked Questions
How Do You Find Historical Property Price Trends?
Last Updated: 30 October 2026
What Historical Property Price Trends Show You
Historical property price trends show how sold prices have moved in an area over time. At JACKSON, we use official records to help people see a fuller picture before they make an offer. A single sold price tells you what one buyer paid on one day. A trend tells you how prices have moved across many sales.
Looking at trends helps you answer questions a listing cannot. Has the street gone up or down over the last decade? Did prices dip in one year and recover in the next? Are nearby areas moving in the same direction?
Most of this data is free to search. The main source in England and Wales is HM Land Registry, which records the price paid for each registered sale.
Keep your expectations realistic. Price trends describe the past. They do not predict what a property will sell for next year, and they do not tell you whether a price is fair.
Using the HM Land Registry Sold Price Search
HM Land Registry publishes Price Paid Data for properties sold in England and Wales (HM Land Registry: Price Paid Data). You can search it by postcode or address to see recorded sales.
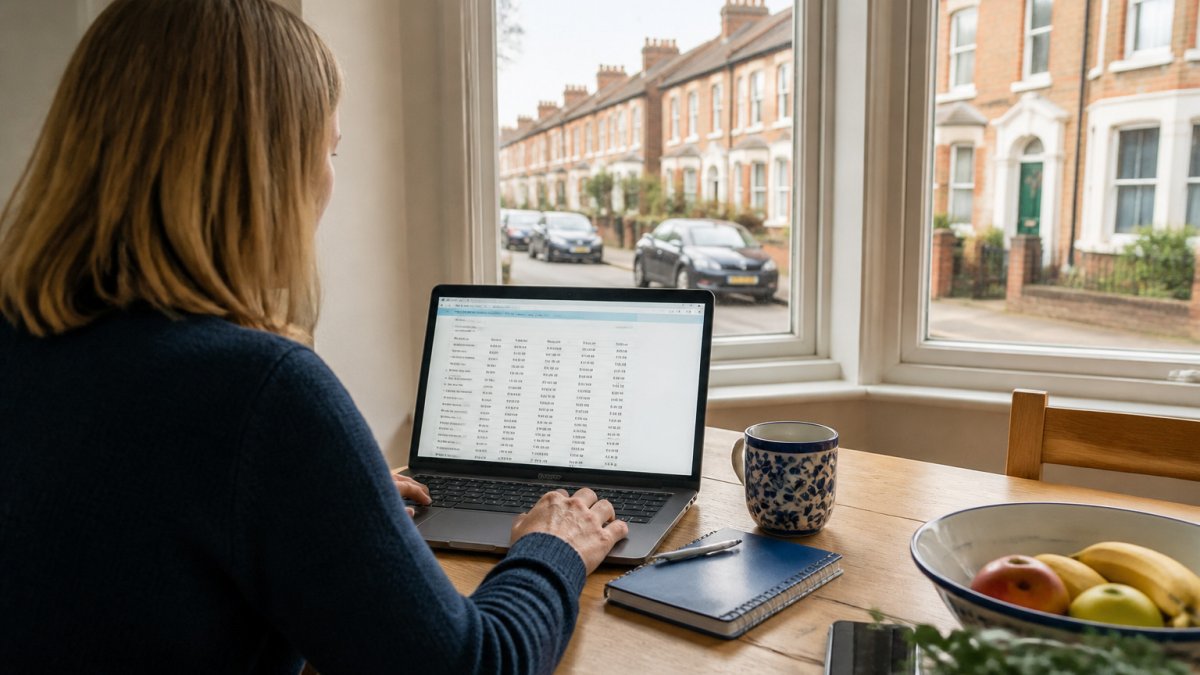
Start with a postcode you care about. Look at the sale dates, prices and property types in the results. Note how many sales appear, because a handful of sales can be misleading on its own.
A few tips to get the most from the search:
- Search several postcodes in the same street or district
- Check the date of each sale, not just the price
- Note the property type, as flats and houses often sell at different levels
- Record your findings in a simple spreadsheet
The search shows completed sales only. It does not show what homes are listed for today.
Finding the UK House Price Index by Postcode
The UK House Price Index, published by HM Land Registry, tracks average price changes over time (UK House Price Index). It is useful for seeing the broader direction of the market, both nationally and by region and local authority.
The index works at a higher level than a single postcode. Use it to set your local figures against a wider benchmark. If a street has risen faster than its council area, that is worth investigating further.
Because the index is an average, it can hide differences within an area. To see how a named council area compares with the rest of England and Wales, you can check how Newcastle-under-Lyme ranks against other council areas using the same official data. Use it as context for the wider market.
How to Compare Sold Prices by Year
To compare prices by year, group the sales you have found into calendar years. Then work out the average or median price for each year.
Median prices are often more reliable than averages, because a few very expensive or very cheap sales can skew an average. If you want to compare yearly price movement across the council areas of Greater Manchester, the official figures make that straightforward. Count the number of sales in each year too. A year with only two sales gives you a weak signal.
Here is a simple way to set up your comparison:
| Step | What to record | Why it matters |
|---|---|---|
| 1 | Year of sale | Groups sales into a trend |
| 2 | Number of sales | Shows how reliable each year is |
| 3 | Median price | Reduces the effect of outliers |
| 4 | Change from last year | Shows direction of movement |
If the number of sales is very low in some years, widen your search to nearby streets or the wider district.
Sold Prices Versus Asking Prices
Sold prices and asking prices measure different things. A sold price is what a buyer paid after the sale completed. An asking price is what a seller or agent hopes to achieve when the home goes on the market.
Asking prices can rise or fall for reasons that have nothing to do with actual demand. A seller might set a high price and later reduce it. A sold price record only appears once a sale has been registered.
This is why the sold data is more useful for trend analysis. Asking prices are better for understanding the market at a given moment, but they do not show what buyers have actually paid.
Understanding What the Data Includes and Leaves Out
Price Paid Data is a record of registered sales, not a record of the housing stock. Knowing exactly what it captures, and what it does not, is what separates a usable trend from a misleading one.
Reporting lag. A sale only appears once it has been registered with HM Land Registry. Registration is not instant, and the most recent two to three months of any search will usually look thinner than the months before.
New-build transactions. New-build sales are included, but they can behave differently from second-hand sales.
Non-standard sales. Some registered sales are not open-market transactions.
Tenure and property type. Price Paid Data records the property type (detached, semi-detached, terraced, flat/maisonette) and the tenure (freehold or leasehold) where recorded.
Condition and improvements. The data does not record condition, extensions, refurbishment or the state of any building.
Geographic coverage. Price Paid Data covers England and Wales. Scotland and Northern Ireland keep their own records, so a trend built on HM Land Registry data for England and Wales does not extend across those borders.
What it is not. The data shows what was paid on a given date. It does not tell you what a property is worth, whether a price is fair, or what will happen next.
Building Your Own Price History for a Postcode
A price history is only as good as the like-for-like comparison behind it. The steps below are the workflow most practitioners use to keep a trend honest, and they are the part most guides skip.
1. Define the search area before you search. Pick a postcode and two or three neighbouring ones that share the same housing stock and transport links. Write the list down.
2. Record every sale, not just the ones that fit. Export or note each sale with its date, price, property type and tenure.
3. Group by year and by property type. A trend that mixes flats and detached houses in different proportions each year is measuring the mix, not the market.
4. Use the median and count the sales. The median is less sensitive to a single unusual sale than the mean. Record the number of sales behind each year alongside the median.
5. Separate nominal from real change. A rise in cash terms is not the same as a rise in real terms.
6. Benchmark against the wider market. Add the UK House Price Index for the same local authority and period.
7. Flag the years that need a caveat. Mark any year with very few sales, a cluster of new-build completions, or a known non-standard transaction.
A simple recording sheet keeps this manageable:
| Field | What to enter | Why it matters |
|---|---|---|
| Search date | The day you pulled the data | Sales are added over time |
| Postcodes covered | The exact list | Keeps the sample fixed |
| Year | Calendar year of sale | Groups the trend |
| Property type | Detached, semi, terraced, flat | Keeps the mix comparable |
| Tenure | Freehold or leasehold | Flats and houses behave differently |
| Number of sales | Count per year | Shows how reliable the year is |
| Median price | Middle value per year | Reduces the effect of outliers |
| Nominal and real change | Cash change and change after inflation | Separates growth from inflation |
| Caveats | Thin years, new-build clusters, unusual sales | Stops a false signal |
Once the history is built, set it against local context, flood risk from the Environment Agency, recorded crime from police.uk, planning activity from the local planning portal and wider statistics from the ONS, so you can see whether a change in prices lines up with a change in the area. For the general buying steps that sit around this, see our guides at jackson.nofooly.com/guides/.
Checking Local Context Alongside Price Trends
Price trends are one piece of the picture. Local factors such as flood risk, crime levels, noise, planning activity and transport links can all shape how an area changes over time.
You can check many of these through official sources. The Environment Agency publishes flood risk information for England (Check the long term flood risk for an area in England). police.uk shows recorded crime by location. Your local council's planning portal lists recent planning applications. The Office for National Statistics publishes wider area statistics.
Use these sources to build context around your price history. A rise in prices alongside a reduction in local crime, for example, tells a different story from a rise alongside increasing flood risk.
For the full detail on a specific property, including its condition, title and planning status, speak to a surveyor and a conveyancer. Area data can inform those conversations but does not replace them.
If you want a combined view of these factors for a postcode, JACKSON's area reports bring official data together in one place, with the sources and dates shown for each figure.
Frequently Asked Questions
How can I find historical property prices?
The most direct free source is the HM Land Registry Price Paid Data, which records completed residential sales in England and Wales. You can search by postcode or address on the HM Land Registry website and see the sale price, sale date and property type for each transaction. For a wider view, HM Land Registry and the ONS publish the UK House Price Index, which shows average price changes by area over time. Combining both lets you check individual sales and the broader trend around them.
Where can I check sold house prices in an area?
HM Land Registry's Price Paid Data is the official record of sold prices in England and Wales and can be searched by postcode or street. Each entry shows the price paid, the date of sale and whether the property was a house, flat, detached or terraced. Because the data comes from completed sales, it reflects what buyers actually paid rather than what sellers asked. Commercial property websites often present the same records in a more visual form, but the underlying figures originate from the official register.
How far back does UK sold-price data go?
HM Land Registry Price Paid Data for England and Wales has been published in its current format from 1995 onwards, covering completed residential transactions. Coverage can vary by area and property type, and some records are added with a delay after the sale is registered. The ONS UK House Price Index has its own start dates depending on the series. Check the release notes for the exact period covered before drawing long-term conclusions.
What is the difference between sold prices and asking prices?
A sold price is the figure recorded when a sale completes, taken from HM Land Registry records. An asking price is what a seller advertises when a property goes on the market, and the final figure is often different. Asking prices can show current expectations in a market, but they do not confirm what anyone paid. For trend analysis, sold prices are the more reliable measure, because they reflect completed transactions rather than marketing intentions.

Short on time? Let us run the checks for you
Viewing this weekend and don't fancy an afternoon of maps? The free Foolproof Viewing Check pulls the headline tiles for any address you're looking at — no card, no sign-up.
Want the whole area read by hand and written up, checked and signed off by a real person before it reaches you? That's the Jackson pre-purchase area report. Software does the legwork so it's quick and affordable; a person makes the call so you can trust it. Reports start from £19.
Frequently asked questions
How can I find historical property prices?
The most direct free source is the HM Land Registry Price Paid Data, which records completed residential sales in England and Wales. You can search by postcode or address on the HM Land Registry website and see the sale price, sale date and property type for each transaction. For a wider view, HM Land Registry and the ONS publish the UK House Price Index, which shows average price changes by area over time. Combining both lets you check individual sales and the broader trend around them.
Where can I check sold house prices in an area?
HM Land Registry's Price Paid Data is the official record of sold prices in England and Wales and can be searched by postcode or street. Each entry shows the price paid, the date of sale and whether the property was a house, flat, detached or terraced. Because the data comes from completed sales, it reflects what buyers actually paid rather than what sellers asked. Commercial property websites often present the same records in a more visual form, but the underlying figures originate from the official register.
How far back does UK sold-price data go?
HM Land Registry Price Paid Data for England and Wales has been published in its current format from 1995 onwards, covering completed residential transactions. Coverage can vary by area and property type, and some records are added with a delay after the sale is registered. The ONS UK House Price Index has its own start dates depending on the series. Check the release notes for the exact period covered before drawing long-term conclusions.
What is the difference between sold prices and asking prices?
A sold price is the figure recorded when a sale completes, taken from HM Land Registry records. An asking price is what a seller advertises when a property goes on the market, and the final figure is often different. Asking prices can show current expectations in a market, but they do not confirm what anyone paid. For trend analysis, sold prices are the more reliable measure, because they reflect completed transactions rather than marketing intentions.