How to Check Air Quality by Postcode: DAQI, AURN Readings and 5-Day Forecasts (UK)
How to check UK air quality by postcode: read the DAQI band, nearest AURN readings and the 5-day forecast, and what the data does and doesn't show.
Enter your postcode at DEFRA's UK-AIR forecasting site or the GOV.UK Check Air Quality service to see the current Daily Air Quality Index band (1 to 10, low to very high), the nearest AURN station's hourly readings and a five-day forecast. Hourly AURN data is provisional until quality-checked, and background-sited stations can miss roadside hotspots.
In this guide
- Table of Contents
- Where to check now: official sites and live maps that cover the UK
- How to read the DAQI and the pollutants that drive it
- Step by step: check air quality for a postcode and read the forecast maps
- Limitations: what official networks and low-cost monitors do not show
- What to do when levels are high: short-term actions and when to seek help
- How to use portable and home air quality monitors for personal checks
- Key indoor air pollutants and how indoor air quality differs from outdoor
- How to interpret air quality data for long-term health planning
- Why I check official local data before judging a neighbourhood
- If you need a deeper area check before you buy: NoFooly postcode reports
- FAQ
- Sources

The fastest way to run an air quality check is to visit UK‑AIR forecasting or the GOV.UK Check Air Quality service and enter your postcode, which covers over 5,000 specific UK locations. Look at the Daily Air Quality Index band shown for your area and, where available, the nearest AURN monitoring station’s hourly reading. If the DAQI is high or very high, cut back on strenuous outdoor activity and follow NHS guidance if breathing symptoms worsen.
TL;DR:
- Air quality measurements are mainly influenced by traffic, industrial activity, and weather conditions, which vary by location and time of day.
- The DAQI scale ranges from 1 to 10, with higher levels indicating increased health risks, especially for people with pre-existing respiratory conditions.
- Official monitoring stations may miss local pollution spikes near roads or sources, and low-cost sensors should be used as trend indicators, not precise measurements.
- High DAQI readings warrant immediate actions such as reducing outdoor activity, closing windows, and seeking medical advice if symptoms worsen.
- Combining short-term DAQI checks with a longer look at an area's history and surroundings gives a better sense of what is driving pollution before you make health or property decisions.
Table of Contents
- Where to check now: official sites and live maps that cover the UK
- How to read the DAQI and the pollutants that drive it
- Step by step: check air quality for a postcode and read the forecast maps
- Limitations: what official networks and low-cost monitors do not show
- What to do when levels are high: short-term actions and when to seek help
- How to use portable and home air quality monitors for personal checks
- Key indoor air pollutants and how indoor air quality differs from outdoor
- How to interpret air quality data for long-term health planning
- Why I check official local data before judging a neighbourhood
- If you need a deeper area check before you buy: NoFooly postcode reports
- FAQ
- Sources
Where to check now: official sites and live maps that cover the UK
Several official services give you current and forecast air quality for any UK location, and each suits a slightly different need.
- UK‑AIR (DEFRA): interactive maps, current measured levels and 5‑day forecasts, with postcode search across over 5,000 locations nationwide.
- GOV.UK Check Air Quality: a quick postcode lookup built around the DAQI, useful when you just want today’s band and a plain-language health message.
- Met Office: supplies the forecasting behind the DAQI and publishes its own text outlooks, which helps when you want a narrative sense of how conditions might change over the week.
- LondonAir and similar university-run sites: give city-specific forecasts, handy if you live or work in a dense urban area with its own monitoring network.
- AURN (Automatic Urban and Rural Network): the hourly measured data behind most of these maps, published with a provisional or verified status depending on how recently it was recorded.
For a snapshot before you leave the house, GOV.UK’s postcode tool is the quickest route. For a fuller picture, including forecast direction and historic readings, UK‑AIR’s mapping and the latest measured levels pages give you more to work with, including downloadable graphs and email alerts.
How to read the DAQI and the pollutants that drive it
The Daily Air Quality Index runs from 1 to 10 and groups into four colour bands: low (1 to 3, green), moderate (4 to 6, amber), high (7 to 9, red) and very high (10, purple). Each band carries specific advice, both for the general population and for people with heart or lung conditions, who are told to act sooner than everyone else.
The index is built from five pollutants, each tracked and reported separately:
- PM2.5 and PM10: fine and coarse particulate matter, often the pollutants that push the index into the highest bands during still, cold weather or smoke events.
- Nitrogen dioxide (NO2): closely tied to traffic, typically highest near busy roads and junctions.
- Ozone (O3): forms in sunlight and tends to peak on warm, still afternoons, often in rural and suburban areas downwind of cities.
- Sulphur dioxide (SO2): linked to industrial combustion and, less often today, domestic coal burning.
DAQI bands and the pollutants behind them are set out in GOV.UK guidance on the index, which explains how the scale translates measured concentrations into health advice. PM2.5 tends to matter most for long-term health risk because it penetrates deep into the lungs, so it is worth checking which pollutant is driving a high reading rather than just noting the overall number.
Step by step: check air quality for a postcode and read the forecast maps
- Open UK‑AIR forecasting or GOV.UK Check Air Quality and type in your postcode rather than just a town name, since levels can vary street to street.
- Note today’s DAQI band and read the five-day forecast text underneath the map, checking whether the figure shown is a forecast or an actual measured reading.
- Find the nearest AURN station through the site’s station list and check its hourly data, noting whether it is flagged provisional or verified, since provisional data is published hourly and quality-checked later.
- Sign up for email alerts on UK‑AIR’s latest measured levels page, or simply screenshot the result if you want to share it with family, a letting agent or a buyer.
This sequence takes a couple of minutes and gives you both the immediate picture and a sense of where things are heading over the next few days, which matters more than a single hourly reading if you are planning outdoor work or deciding whether to view a property on a particular afternoon.
Limitations: what official networks and low-cost monitors do not show
Official data is reliable but not complete, and it pays to know where the gaps sit.
- Provisional AURN data is published hourly and goes through quality control afterwards, so treat an early reading as a guide for awareness rather than a final, regulatory-grade figure.
- Station siting favours background and general urban locations, which means AURN monitoring can miss roadside hotspots or very local nuisances such as a neighbouring business burning waste.
- Low-cost sensors and wearables vary in accuracy between models and over time, which is why the Environment Agency sets MCERTS performance standards for equipment used in regulatory or accredited testing.
- Local context matters: proximity to a main road, an industrial site or frequent domestic burning can affect air quality in ways a national map will not fully capture.
Pro Tip: Treat a single hourly reading as one data point, not the full story, and check the forecast trend alongside the current figure before deciding whether to change your plans.
What to do when levels are high: short-term actions and when to seek help
A high or very high DAQI reading calls for practical, immediate steps rather than panic.
- Cut back on strenuous outdoor exercise, especially near busy roads, and keep windows closed if there is visible smoke or haze outside.
- If you have asthma, COPD or a heart condition, follow your own action plan and treat increased inhaler use as a signal to seek advice from a GP or pharmacist.
- Time ventilation for quieter pollution periods, run extractor fans when cooking, and consider a HEPA air purifier if indoor pollution is a recurring problem rather than a one-off.
- For severe breathing difficulty, chest pain, or blue or pale lips and skin, call 999 or go to A&E immediately; for symptoms that are worsening but not an emergency, contact your GP or NHS 111.
If indoor air feels persistently poor, that is a sign to look into professional testing or remediation rather than relying on short-term fixes such as an open window.
How to use portable and home air quality monitors for personal checks
A portable monitor gives you a reading specific to your own kitchen, bedroom or garden, which official outdoor maps cannot offer. Place it away from direct draughts, cooking fumes or open windows if you want a baseline reading, then compare it against conditions when you are cooking, burning candles or have visitors smoking nearby. Most consumer monitors track PM2.5 and sometimes carbon dioxide or volatile organic compounds, giving you a rough sense of how your home behaves through the day.
Run the device over a full 24 hours rather than checking it once, since indoor air quality often spikes briefly during cooking or cleaning and then settles. Compare your readings against the outdoor DAQI for the same day: if indoor levels are consistently higher even when outdoor air is “low,” the issue is probably something inside the home, such as a gas hob without adequate extraction or damp affecting air flow.

Because low-cost sensors vary in accuracy between models, treat a home monitor as a trend tool rather than a certified measurement. If you need a figure for a formal assessment, such as a workplace or rental dispute, that requires accredited testing rather than a consumer device.
Key indoor air pollutants and how indoor air quality differs from outdoor
Indoor air quality is shaped by a different set of sources than outdoor air, even though some outdoor pollutants do seep inside. The main indoor concerns are particulate matter from cooking and candles, nitrogen dioxide from gas appliances, volatile organic compounds from paints, furnishings and cleaning products, and damp-related mould spores.

Unlike outdoor air, which is diluted by wind and open space, indoor pollutants can build up in a sealed room, especially in well-insulated modern homes with limited natural ventilation. A gas hob used without an extractor fan can push indoor NO2 well above typical outdoor street levels within minutes of cooking. Damp and mould are a separate but related concern, since persistent moisture encourages spore growth that can affect respiratory health over time, and this is worth checking for directly rather than assuming an air quality monitor will catch it.
The practical takeaway is that a good outdoor DAQI reading tells you little about what you are breathing inside your own home. Ventilation habits, appliance maintenance and damp control matter as much indoors as the outdoor pollution levels you check on a map.
How to interpret air quality data for long-term health planning
A single day’s DAQI reading tells you very little about long-term risk, but a pattern of repeated high readings in a specific area is worth paying attention to, particularly if you or a family member has an existing respiratory or cardiovascular condition. Checking UK‑AIR’s historical data and forecasts over several weeks, rather than a single visit, gives a better sense of whether a location has a recurring pollution problem tied to traffic, local industry or seasonal wood burning.
For anyone deciding where to live, work or send children to school, it helps to look at a location’s typical pollution pattern across different times of day and seasons, rather than treating one reading as representative. A street that looks clean on a breezy Tuesday afternoon might tell a different story during a still week in January.
This kind of long-term view also matters for anyone managing a chronic condition, since clinical advice recommends monitoring your own baseline symptoms and treating changes as a cue to review your action plan rather than relying solely on an area’s average reported air quality.
Why I check official local data before judging a neighbourhood
I use the DAQI and UK‑AIR’s postcode tools as a first, fast read on a place, not a final verdict. A good day’s forecast tells you little about a street’s long-term pattern, and no map replaces walking the area or checking what is actually built nearby. When I am weighing up a neighbourhood seriously, I treat the forecast as one input among several, alongside the kind of local, area-level checks that catch what a single reading cannot.
— Gracie C
If you need a deeper area check before you buy: NoFooly postcode reports
Checking the DAQI tells you about the air on a given day. It says nothing about what is planned next door, how a street’s flood history looks, or how the quiet-looking road scores on mapped noise levels. Plain-English postcode area reports are available for England & Wales, starting with a free automated Viewing Check and running up to a person-read Area Report that covers flood risk and recorded floods, crime, noise and nuisance sites, planning applications nearby, broadband and commute times.
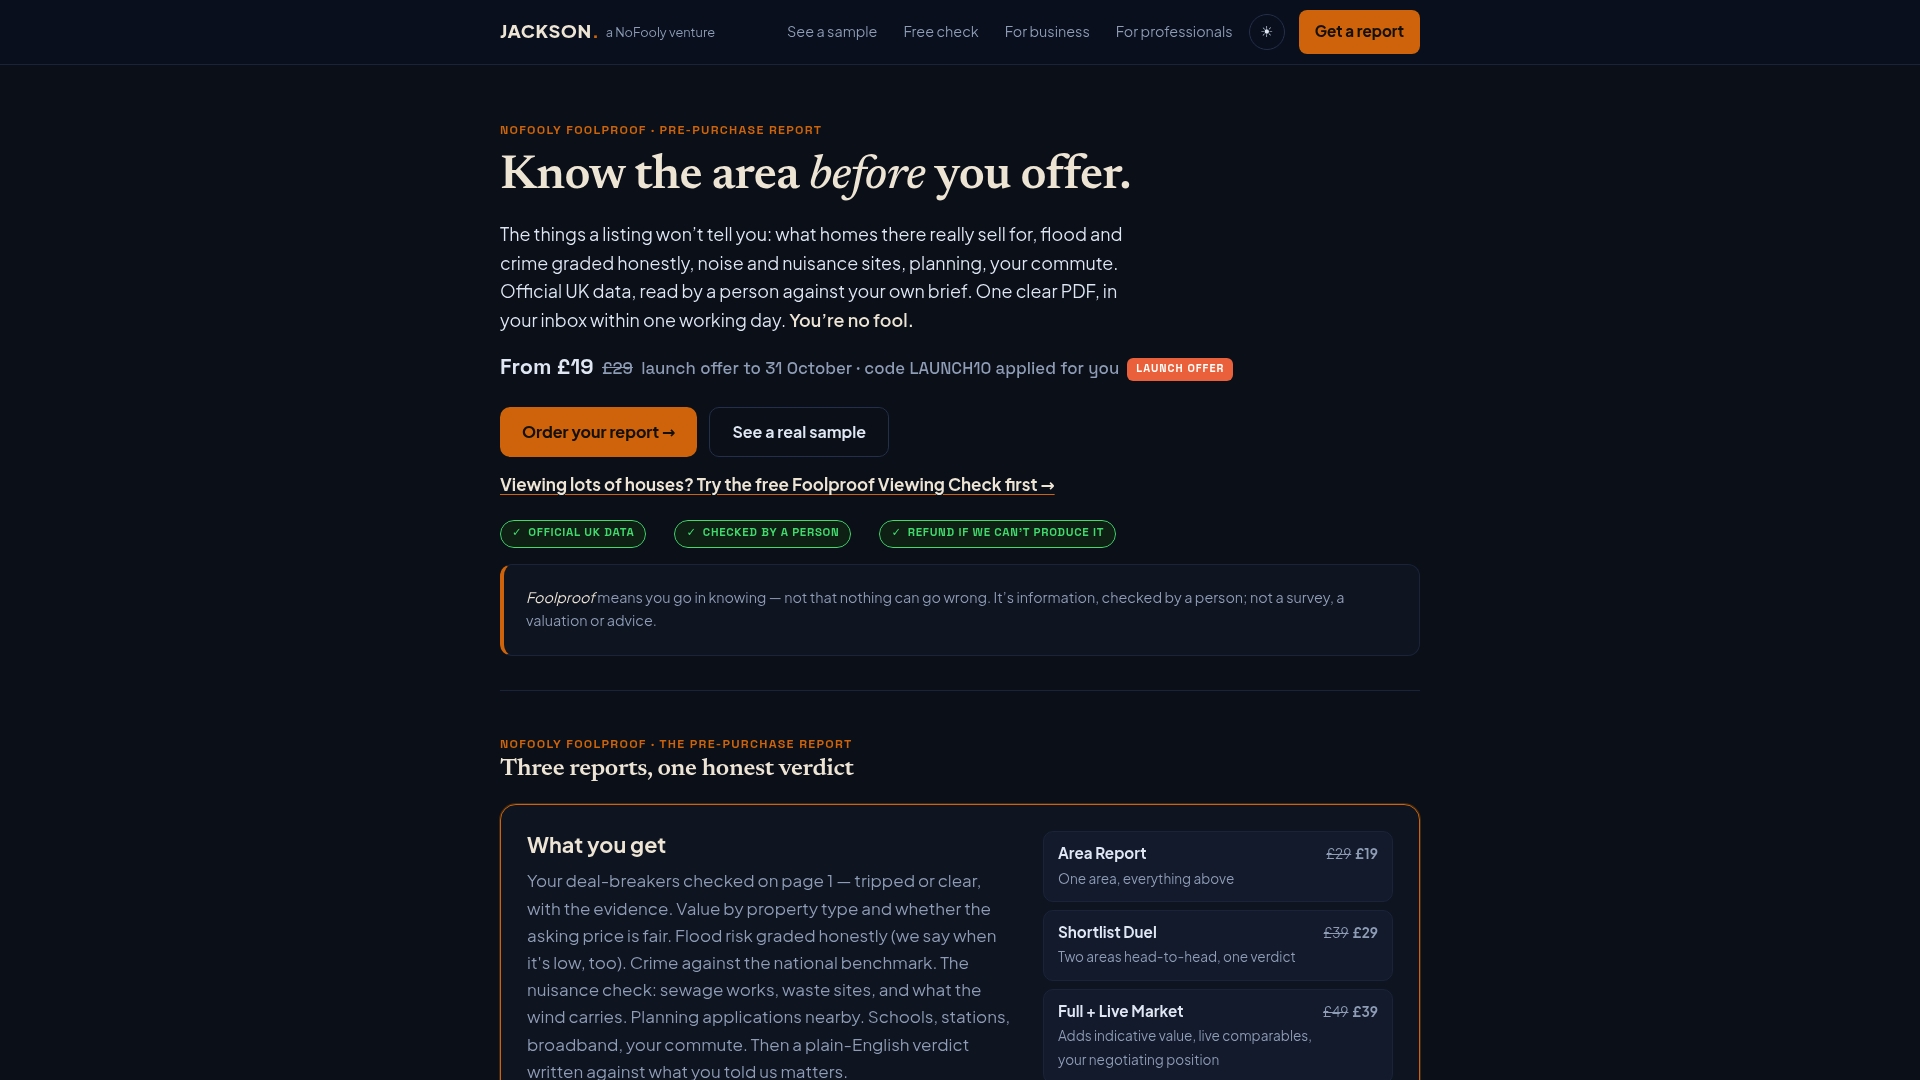
This is not a survey and will not tell you about damp, subsidence or the state of the boiler, and it does not replace a conveyancer’s searches or legal advice. What it does is pull together the area-level context that a day’s air quality check cannot, so you are looking at the fuller picture before you commit to viewing or bidding on a place.
- Instant Report: a £9 report generated from the postcode and checked by a review agent, not read by a person, delivered as a PDF within minutes.
- Area Report: a detailed report read against your own brief and deal-breakers, with a verdict delivered within one working day.
- Shortlist Duel: a service comparing two areas head to head when you are torn between neighbourhoods.
| Report | Price | Best for |
|---|---|---|
| Instant Report | £9 | A fast first look at sold prices, planning, flood and crime data |
| Area Report | From £19 | A person-checked verdict against your own deal-breakers |
| Shortlist Duel | A comparative option | Comparing two shortlisted areas side by side |
Pair a few days of DAQI checks for the postcode with a NoFooly Area Report and you get both the short-term air picture and the longer-term local context before you make an offer.
This article is general information, not a substitute for advice from a qualified doctor. Consult a qualified healthcare professional about your own circumstances before acting on anything here.
FAQ
How to treat bad air quality symptoms at home?
Keep windows closed if smoke or haze is visible outside, run extractor fans when cooking, and avoid strenuous activity until the DAQI band drops. If you have asthma, COPD or a heart condition, follow your own action plan and seek urgent medical help for severe breathing difficulty, chest pain or blue or pale skin.
What is the current air quality in the United Kingdom?
Current air quality varies by location and changes through the day, so check UK‑AIR’s forecasting and mapping tool with your postcode for an up-to-date reading. The DAQI band shown will tell you whether conditions are low, moderate, high or very high for your area right now.
What are the downsides of using air quality monitors?
Low-cost and wearable monitors vary in accuracy between models, which is why regulatory and accredited testing relies on equipment meeting MCERTS performance standards. Treat a consumer monitor’s reading as a useful trend indicator rather than a certified measurement for formal purposes.
How to become an air quality tester?
Air quality monitoring at a professional or regulatory level typically requires using MCERTS-certified equipment and following recognised calibration and quality-control procedures set out by the Environment Agency. There is no single qualifying route described here, so anyone considering this as a career should look into accredited training and certification schemes directly with the relevant bodies.
Sources
Road traffic is the dominant source of nitrogen dioxide in most UK towns and cities, which is why NO2 readings are consistently highest near busy junctions and arterial roads. Domestic wood burning and solid fuel stoves are a significant contributor to fine particulate matter, particularly on still winter evenings when smoke cannot disperse easily. Industrial combustion remains the main source of sulphur dioxide in areas near power generation or heavy manufacturing, though this has declined substantially compared with past decades.
Agricultural activity, particularly fertiliser and livestock emissions, contributes to background particulate levels in rural areas, while construction and demolition work can generate localised dust spikes that do not necessarily show up on regional monitoring networks. Weather plays a role too: still, cold conditions trap pollutants near ground level, while wind and rain help disperse them, which is part of why DAQI forecasts vary so much from one day to the next even without any change in emissions.
Understanding which source is likely behind a reading helps you judge how long it might last. A traffic-driven NO2 spike during rush hour usually eases within hours, while a wood-smoke episode on a cold, windless night can persist well into the next morning.
Short on time? Let us run the checks for you
Viewing this weekend and don't fancy an afternoon of maps? The free Foolproof Viewing Check pulls the headline tiles for any address you're looking at — no card, no sign-up.
Want the whole area read by hand and written up, checked and signed off by a real person before it reaches you? That's the Jackson pre-purchase area report. Software does the legwork so it's quick and affordable; a person makes the call so you can trust it. Reports start from £19.