How to calculate UK price per square foot: RICS vs EPC floor areas, local benchmarks, and a £29 area report
Calculate the UK price per square foot, check RICS vs EPC measurements, compare to local medians, and where a £29 person-checked area report fits (England and Wales).
In this guide
- Table of Contents
- How do you calculate price per square foot?
- Why do RICS GIA and EPC figures give different numbers?
- What is a good price per square foot in the UK?
- How should you interpret a PPSF figure when making an offer?
- Where can you find reliable UK price-per-square-foot data?
- Where a Nofooly area report fits alongside a PPSF figure
- What buyers consistently get wrong about PPSF
- Want your PPSF figure checked against real local data?
- Sources
- FAQ
- Recommended
Price per square foot (PPSF) is a property’s sale price divided by its internal floor area, measured in square feet. UK medians typically vary by region and property type, showing significant differences in price per square foot, but that range swings hard by region and property type. HM Land Registry sale records, ONS mapping data, RICS measurement standards, and Local checks can feed into a genuinely usable benchmark, but only if you know what you’re actually measuring.
TL;DR:
- The most accurate price per square foot measurements come from formal surveys like RICS GIA rather than estimates like EPC figures, which can vary and contain errors.
- Regional PPSF benchmarks differ widely, with London inner boroughs often multiples above the North, and the median is more relevant than national averages for precise comparisons.
- A PPSF significantly outside the local p20–p80 sales band signals the need to investigate factors like condition, tenure, or potential overpricing, rather than assuming it’s a market mistake.
- Matching sale prices to local PPSF benchmarks and checking for recent comparable sales can reduce the risk of overpaying, though it is a benchmark, not a valuation.
- Nofooly’s area reports add recent sold prices by street and type plus flood, crime, planning and nuisance context, so a raw PPSF figure is read alongside the area rather than on its own.
Table of Contents
- How do you calculate price per square foot?
- Why do RICS GIA and EPC figures give different numbers?
- What is a good price per square foot in the UK?
- How should you interpret a PPSF figure when making an offer?
- Where can you find reliable UK price-per-square-foot data?
- Where a Nofooly area report fits alongside a PPSF figure
- What buyers consistently get wrong about PPSF
- Want your PPSF figure checked against real local data?
- Sources
- FAQ
How do you calculate price per square foot?
Divide the sale price by the internal floor area in square feet. For example, a property priced at £320,000 with a floor area of 800 sq ft would have a price per square foot calculated by dividing the price by the area. If your floorplan or EPC gives the area in square metres, multiply by 10.764 to convert to square feet (one square metre equals roughly 10.76 sq ft).
The tricky part isn’t the maths. It’s getting the floor area right in the first place.
- Find the floor area. Check the EPC register, the estate agent’s floorplan, or a RICS-compliant survey. These three sources don’t always agree.
- Prefer the most recent, most formal measurement. A RICS Gross Internal Area (GIA) figure from a chartered surveyor beats an EPC estimate, which in turn beats a rough floorplan guess.
- Convert consistently. Keep everything in the same unit before you divide. Mixing sqm and sqft mid-calculation is the single most common error.
- Divide sale price by floor area. That’s your PPSF.
- Sanity-check against a local benchmark before drawing any conclusion from the number alone.
A common mistake is using the advertised “total area” from a listing, which sometimes includes a garage, loft space, or garden room that a formal measurement would exclude. Another is forgetting that a bay window or a chimney breast recess can shift a floorplan estimate by 20 to 30 square feet on an average terrace, enough to move PPSF by several pounds.
Why do RICS GIA and EPC figures give different numbers?
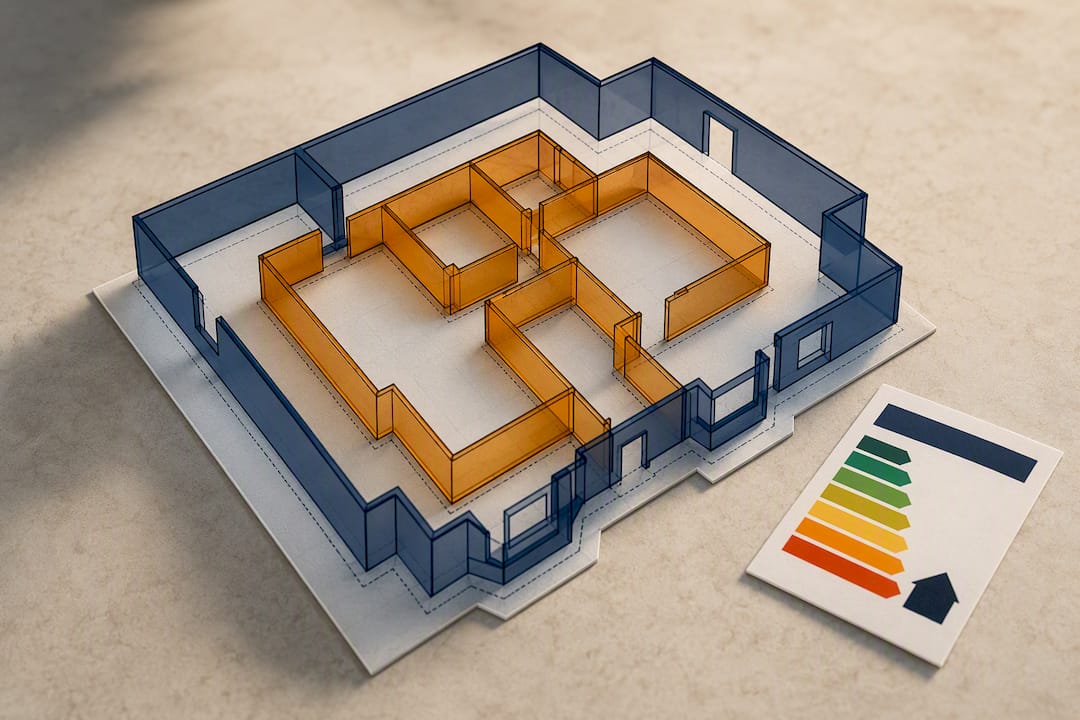
Measurement standard changes the number, not just the price. RICS Gross Internal Area is the standard most UK residential valuations and agent particulars use. GIA includes internal partition walls but excludes external wall thickness, balconies, and open external areas. Net Internal Area (NIA) strips out core and common areas too, which is why commercial and some flat measurements read smaller under NIA than GIA for what’s physically the same space.
EPC floor areas are convenient because they’re free and searchable, but they’re self-reported by the assessor and occasionally contain rounding errors or miscounted extensions.
- Ask which standard a listed floor area uses before comparing two properties.
- Cross-check the EPC figure against the floorplan if the two look inconsistent.
- Treat a NIA figure as smaller than GIA for the same building, not as a sign the property has shrunk.
Pro Tip: If a PPSF figure looks unusually high or low compared with the street, check whether the floor area came from an EPC or a formal RICS survey first. That single detail explains more anomalies than any market quirk.
What is a good price per square foot in the UK?
There’s no single “good” figure. Context does the work. National medians hide enormous regional spread, and the sensible approach is comparing a property against its own local matched-sale median rather than a country-wide average.
Matched-sale datasets, built by linking HM Land Registry sale prices to EPC floor areas, give the most realistic regional picture. Homello’s regional tables illustrate just how wide that spread runs across England and Wales.
| Region | Typical PPSF range | Notes |
|---|---|---|
| London (inner boroughs) | High, often several multiples of the North of England | Kensington & Chelsea sits far above outer boroughs like Barking & Dagenham |
| South East | Above national median | Commuter belt premium around rail links |
| Midlands | Broadly around national median | Wide urban/rural gap within the region |
| North West | Below national median | Manchester city centre flats buck the regional trend |
| North East | Lowest in England | Strong terrace/semi price bands |
| Wales | Below national median | Coastal towns often price above the regional average |
| Scotland | Varies sharply by city | Edinburgh runs well above Glasgow in most matched datasets |
Within a single London borough, PPSF can swing by hundreds of pounds between streets, driven by school catchments, transport links, and building age. Zoopla has mentioned an approximate average price per square foot figure for the UK which can be used as a rough guideline, but is not definitive, useful as a rough anchor but not a substitute for a local matched median.
New-build flats frequently sell at a price per square foot premium compared to older properties in the same area, and leasehold versus freehold tenure can flip the usual PPSF relationship between houses and flats in the same postcode. Any regional table also reflects a rolling sales window, typically 12 to 24 months, so treat older figures with caution in a fast-moving local market.
How should you interpret a PPSF figure when making an offer?
A high PPSF against the local median usually signals a premium for condition, a new-build uplift, or a scarcity of similar stock nearby. A low PPSF often points to deferred maintenance, an unfavourable tenure, or a location factor the headline price doesn’t capture.
PPSF also ignores land value entirely, which matters more for houses with gardens than for flats, and it can’t tell you whether a leasehold has 15 years or 900 years left on the term.
- Pull the local matched-sale median for the same property type.
- Check where the asking price sits against the middle 60% (the p20–p80 band) of recent local sales rather than a single average.
- If the figure sits outside that band, treat it as a flag to investigate, not a verdict.
- Ask why: condition, tenure, land size, or genuine overpricing.
- Cross-reference against price per room or price per square metre for a second opinion on the same property.
Pro Tip: When a property’s PPSF sits well outside the local p20–p80 band, run five quick checks: floor area source, tenure length, year built, recent comparable sales on the same street, and any planning applications nearby that could affect future value.
Where can you find reliable UK price-per-square-foot data?
HM Land Registry price paid data records the actual completed sale price, which is why matched-sale PPSF beats asking-price PPSF for judging real market value. Matching those sale prices to EPC floor areas is standard practice among data providers building regional PPSF tables.
ONS publishes broader price-per-area mapping and methodology that underpins many of these regional comparisons.
- HM Land Registry: official completed sale prices, the backbone of any matched dataset.
- EPC open data: floor areas, but check for assessor error on unusual layouts.
- ONS: regional context and methodology for price-per-area analysis.
- Coverage gap to note: matching works reliably for England and Wales; Scotland and Northern Ireland often need separate sources.
- Before trusting a published median, check the sample size, the date range, and whether the source shows a p20–p80 band rather than a bare average.
Where a Nofooly area report fits alongside a PPSF figure
A PPSF number on its own can’t tell you why a property sits outside the local band. A Nofooly pre-purchase report lists recent sold prices for the street and the area by property type, alongside current asking prices, so you can run the comparison yourself, then layers in flood risk, crime figures, planning applications, and nuisance sites that a bare PPSF calculation never touches.
On the £29 tier a named person reads the report against your own brief and gives an indicative view of whether the asking price looks in line with local evidence. That is orientation, not a valuation, and it says nothing about the building’s condition, which is the surveyor’s job. It does catch the cases where a raw number alone would mislead a buyer sitting a long way from the local market.
What buyers consistently get wrong about PPSF
Three mistakes come up again and again: comparing figures measured to different standards, ignoring tenure entirely, and assuming a new-build premium reflects genuine long-term value rather than a one-off launch price. The fix is always the same order of operations: calculate the figure properly, benchmark it against the right local median, then verify anything unusual with a proper local check rather than a guess.
— Wayne
Want your PPSF figure checked against real local data?
Nofooly is the practical alternative to guessing from a listing’s headline price. Rather than working out a PPSF figure with no local sold prices to set it against, a Nofooly area report gives you the recent sold prices for the street and the area by type, then checks the risk factors a raw calculation can’t see: flood exposure, crime data, nearby planning applications, and nuisance sites.

Reports cover England and Wales only and start from £9; the £29 tier is read by a named person against your own brief and includes an indicative view of whether the asking price looks in line with local evidence, orientation rather than a valuation. If a property’s numbers look odd against the local median, get an area report before you commit to anything, and keep the survey for the building. This article is general information, not financial advice; consult a qualified professional about your own circumstances before acting on it.
Sources
- Gov
- House prices: how much does one square metre cost in your area? — ONS
- Price per square foot by area, with calculator — Homello
- Your guide to square footage: the true cost of floor space — Zoopla
FAQ
What is a good price per square foot in the UK?
There’s no fixed figure. A “good” PPSF is one that sits close to the local matched-sale median for that property type, so always compare against the specific area rather than a national average.
Is 1,500 square feet a big house in the UK?
Yes, by UK standards. A typical three-bedroom semi usually means a property with a moderate-sized floor area, and a larger figure typically indicates a four-bedroom house or an extended property.
Can you buy a house for £50,000 in the UK?
Only in a small number of areas, typically ex-industrial towns in the North East or parts of Wales, and usually for smaller terraces needing work. In most of England, prices are generally well above what a modest deposit might cover on an average property.
How do you work out price per square foot?
Divide the sale price by the internal floor area in square feet, using a RICS or EPC-sourced measurement rather than an estimate. Convert from square metres by multiplying by 10.764 if that’s the unit your floorplan uses.
Recommended
Short on time? Let us run the checks for you
Viewing this weekend and don't fancy an afternoon of maps? The free Foolproof Viewing Check pulls the headline tiles for any address you're looking at — no card, no sign-up.
Want the whole area read by hand and written up, checked and signed off by a real person before it reaches you? That's the Jackson pre-purchase area report. Software does the legwork so it's quick and affordable; a person makes the call so you can trust it. Reports start from £29.