Reading Road Safety Data Near Residential Streets
Road safety data near residential streets can be hard to interpret. Learn to read collision figures and maps to compare areas before you move.
Road safety data for residential streets comes from police-reported injury collisions (STATS19), published by the Department for Transport and mapped by tools such as CrashMap. It records date, location, severity (slight, serious, fatal) and road-user type, but excludes near misses and unreported knocks. Zoom to the actual junction, filter by severity and year, and compare rates rather than raw counts.
In this post
- Table of Contents
- What Road Safety Data Near Residential Streets Actually Tells You
- Road Collision Data by Location: What Gets Recorded
- Road Accident Statistics by Postcode and What They Hide
- Using a Road Safety Map to Compare Nearby Streets
- Local Road Safety Data Sources Worth Checking
- Visualising Residential Risk: Speed, Volume and Street Layout
- What Residents Can Do About a Street That Worries Them
- Adding Road Safety Data to Your Area Check
- Frequently Asked Questions
Last Updated: November 3, 2026
Quick Summary
Road safety data near residential streets records reported collisions, casualties and traffic conditions on the roads where people live, drawn from police forces via the official crash reporting system. It describes what happened, not how safe a street feels, and it excludes near misses and unreported incidents. Treat a postcode figure as a starting point, not a verdict.
- A postcode covers a cluster of addresses, so its count can sum a quiet cul-de-sac and a busy A-road.
- Official collision data splits casualties into slight, serious and fatal, and the mix matters more than the total.
- A low count can mean congested traffic that never reaches injuring speeds, not a safe street.
- Zoom a road safety map to the actual junction, filter by severity and year, and note road user types.
- On an adopted road, the local highway authority handles maintenance, signs, crossings and traffic calming.
Table of Contents
- What Road Safety Data Near Residential Streets Actually Tells You
- Road Collision Data by Location: What Gets Recorded
- Road Accident Statistics by Postcode and What They Hide
- Using a Road Safety Map to Compare Nearby Streets
- Local Road Safety Data Sources Worth Checking
- Visualising Residential Risk: Speed, Volume and Street Layout
- What Residents Can Do About a Street That Worries Them
- Adding Road Safety Data to Your Area Check
- Frequently Asked Questions
What Road Safety Data Near Residential Streets Actually Tells You
Road safety data near residential streets is the record of reported collisions, casualties and traffic conditions on the roads where people actually live. For house hunters across England and Wales, the first lesson is always the same: the numbers describe what happened, not how safe a street feels or will be. Below, we show you exactly how to read a collision record, where the gaps sit, and how to use it alongside the other checks you run before an offer.
The figures come from police forces, via the official crash reporting system. They are useful, but they are also incomplete. That gap matters more than most buyers realise.
Road Collision Data by Location: What Gets Recorded
A record enters the system when someone reports a collision to the police. The official road safety statistics collection sets out what gets captured: date, time, location, road type, severity, and the types of road user involved.
What gets recorded, in practice:
- Personal injury collisions where police attended or the injury was reported
- Casualty severity split into slight, serious and fatal
- Road user type, from pedestrians to cyclists to car occupants
- Location tied to a road, junction or approximate coordinate
What does not get recorded: near misses, minor damage-only knocks, and incidents no one reported. A street can feel dangerous while its collision count stays low, simply because nothing was officially logged.
Road Accident Statistics by Postcode and What They Hide
Postcode-level road accident statistics need careful handling. A postcode covers a cluster of addresses, not a single street. The collision may sit on the main road at the edge of the postcode, several minutes' walk from the house you are viewing.
The reason is mechanical. Police record a collision against a location, and the published data ties it to a coordinate and a road, not to a postcode as such. A single postcode can therefore straddle a quiet cul-de-sac and a busy A-road, and the count you see is the sum of both.
Three things a postcode count hides:
- Where exactly the collision happened within the area
- How busy the road was at the time
- Whether the pattern repeats or was a one-off
So treat a postcode figure as a starting point, not a verdict. It tells you to look closer. It does not tell you the street is dangerous.
Reading the Severity Split Properly
The headline total flattens three very different outcomes. Official collision data separates casualties into slight, serious and fatal, and the mix matters more than the sum. A postcode with ten slight collisions on a slow shopping street tells a different story from one with two serious pedestrian casualties at a junction. When you look at a figure, ask what proportion were serious or fatal, and which road users were involved. A cluster of cyclist casualties on a commuter route is a different problem from car-occupant shunts at a roundabout.
Why a Low Count Is Not Always Good News
A low collision count can mean a genuinely quiet street. It can also mean the opposite: a road so congested that traffic never reaches the speeds where injuries happen. Slow, crawling traffic produces fewer casualties and a worse place to live.
Under-reporting skews things too. Minor pedestrian and cyclist incidents often go unrecorded, so a low figure may reflect reporting habits rather than real conditions. Injury collisions that never involve the police, a cyclist who picks themselves up and rides on, leave no trace in the data at all.
A postcode with zero recorded collisions is not evidence of a safe street; the recorded data may simply not capture every incident in the area.
Using a Road Safety Map to Compare Nearby Streets
A road safety map plots recorded collisions onto a street layout, which is far more useful than a single postcode total. The crashmap tool built on official collision data lets you zoom to a junction and see individual incidents by severity.
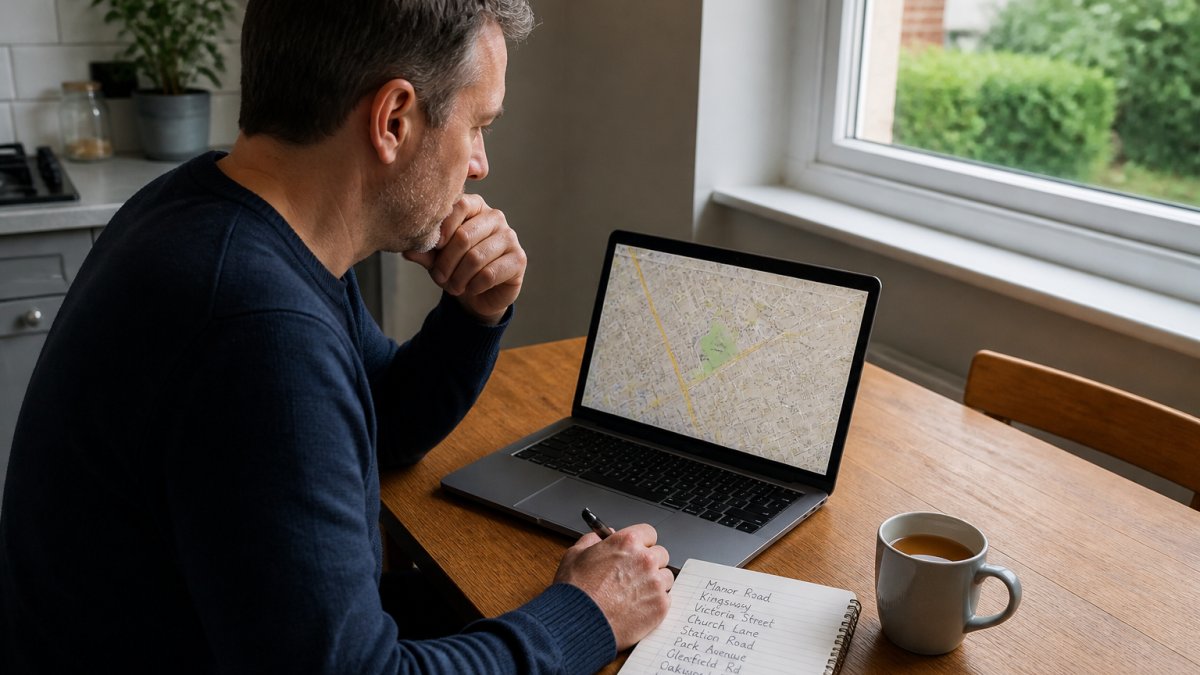
When comparing streets, work through a short routine:
- Zoom to the actual junction or road, not the postcode centre
- Filter by severity and by year, so old clusters do not distort the picture
- Note the road user types involved, since pedestrian and cyclist casualties signal different risks
- Check whether incidents cluster at one junction or spread along the road
That comparison is where the map earns its keep. Two streets a few hundred metres apart can show very different patterns.
Local Road Safety Data Sources Worth Checking
Official local road safety data sources are free and open, and worth checking yourself. Start with the Department for Transport's published road safety statistics, then narrow down.
Sources we point buyers to:
- Police.uk for street-level crime data by area, with CrashMap for recorded collisions
- The local highway authority for traffic calming schemes and road safety audits
- The local planning portal for developments that will add traffic
- The council's road adoption records, since maintenance responsibility sits with the authority on adopted roads
If the road outside a home is unadopted, who pays for repairs becomes a live question, and a conveyancer can confirm the road's status before exchange.
Visualising Residential Risk: Speed, Volume and Street Layout
Speed, traffic volume and street layout shape risk more than any single collision count. A wide, straight road invites faster driving. A narrow street with parked cars and tight corners slows it. Neither fact appears in a collision table.
How to read the physical street:
- Width and sightlines: long clear stretches tend to carry faster traffic
- Parking: parked cars slow traffic but block the view at crossings
- Junctions: side-road junctions and blind corners concentrate conflict points
- Footway provision: a street with no pavement changes how pedestrians move
What Residents Can Do About a Street That Worries Them
Residents have real routes to action, and they start with evidence. A cluster of recorded collisions at one junction is far more persuasive to a highway authority than a general complaint about speed. This is the part most data pages skip: the gap between a statistic and a change on the ground.
Build the Evidence File First
Before approaching anyone, assemble the record yourself. Pull the collision data for the specific junction from the published sources, note the dates, severities and road users involved, and add your own log of near misses with times and locations. A near-miss log is not official data, but it shows a pattern the official figures may miss because nothing was reported. Keep it factual and dated; a page of specific entries carries more weight than a paragraph of complaint.
Who Actually Decides
The body responsible for the road depends on its status. On an adopted road, the local highway authority, usually the county or unitary council, is responsible for maintenance, signs, crossings and traffic calming. On an unadopted road, responsibility can sit with residents or a private owner, which changes who you approach. Our guide to unadopted roads sets out how to confirm status with your conveyancer. Ward councillors can raise a case internally, and many authorities publish a formal process for requesting a speed survey or a road safety audit at a junction.
The Levers That Exist
- Speed surveys and traffic counts, ask the highway authority whether the road has been surveyed and what the recorded speeds were
- Road safety audits, new schemes and major junctions are audited; ask whether one was done and whether it is public
- Local transport and cycling plans, consultations on these are where traffic calming and 20mph schemes get funded, and evidence submitted at consultation stage carries more weight than complaints afterwards
- Community speed watch, many forces support resident-led speed monitoring, which generates its own data
- Planning objections, a development that will add traffic to your street is a legitimate point to raise through the local planning portal, with the collision record attached
Community safety advocacy works best when it is specific and tied to a named junction or stretch. "Three collisions at this corner in two years, two involving cyclists" carries weight. "This road feels fast" does not.
If a traffic scheme or local plan affecting your street is open, check the closing date before you start gathering data.
Adding Road Safety Data to Your Area Check
Road safety data belongs in a wider area check, not on its own. Pair it with crime figures, flood risk, noise and planning history, and you get a rounded picture of a place before you commit.
That is where an area check helps with the rest. It pulls the crime, flood, noise and planning figures into one place, so you are not chasing five different portals on a deadline, and you can set the collision record beside them.
A word of caution: an area report sits alongside a survey, never instead of it. We do not assess the condition of any building, and legal title, boundaries and a specific property's planning status are for your conveyancer. What we do is show you the recorded data, with sources and dates, so your decision rests on evidence rather than a listing's gloss.
| Check | What it tells you | Where it comes from |
|---|---|---|
| Collision record | Reported injuries by severity and road user | Police collision data |
| Street layout | Speed, sightlines, junctions, footways | Site visit and maps |
| Traffic volume | How busy the road gets | Council and national counts |
| Wider area profile | Crime, flood, noise, planning | Official open data |
Frequently Asked Questions
Where can I find road collision data for a residential street?
Start with CrashMap, which plots official police-reported collision data by location, severity and year. The Department for Transport publishes annual road casualty statistics for England and Wales, and your local highway authority often holds its own collision records. Combine these with a road safety map to see how a specific street sits within the wider network. Check the date on every dataset, because reporting lags vary between sources.
Do road accident statistics by postcode show every incident?
No. Police-recorded collision data generally covers incidents involving injury, and minor damage-only collisions are usually excluded. Reporting practice also varies between forces, and some records are amended after the initial report. A postcode showing zero collisions may simply have had none recorded, not none that happened. Treat the figures as a guide to relative risk between streets rather than a complete record.
How far back do local road safety data sources go?
The Department for Transport publishes collision datasets going back well over a decade, and police.uk holds several years of street-level records. Older years are useful for spotting a trend, such as a junction that repeatedly appears. Local highway authorities may hold longer internal records. Always check the last-updated date, since recent months are often provisional or incomplete.
How can I compare collision data between nearby streets?
Pick streets of similar character, then compare collision counts over the same period and normalise by traffic volume where figures allow. A busy through-road will usually show more collisions than a quiet cul-de-sac, so look at casualty rates rather than raw counts. A road safety map helps here, showing clusters at junctions and bends. Note the road type and speed limit for each street before drawing conclusions.
Before you commit to a street, test it against the record rather than the impression. JACKSON combines crime figures, flood risk, noise and planning history into one plain-English report, with every figure carrying its source and date; from £19 a named analyst reads it against your own brief and signs the verdict, and you can set the collision record beside it. Start with the free Viewing Check and see what the data says about the area you are considering.

Short on time? Let us run the checks for you
Viewing this weekend and don't fancy an afternoon of maps? The free Foolproof Viewing Check pulls the headline tiles for any address you're looking at — no card, no sign-up.
Want the whole area read by hand and written up, checked and signed off by a real person before it reaches you? That's the Jackson pre-purchase area report. Software does the legwork so it's quick and affordable; a person makes the call so you can trust it. Reports start from £19.
Frequently asked questions
Where can I find road collision data for a residential street?
Start with CrashMap, which plots official police-reported collision data by location, severity and year. The Department for Transport publishes annual road casualty statistics for England and Wales, and your local highway authority often holds its own collision records. Combine these with a road safety map to see how a specific street sits within the wider network. Check the date on every dataset, because reporting lags vary between sources.
Do road accident statistics by postcode show every incident?
No. Police-recorded collision data generally covers incidents involving injury, and minor damage-only collisions are usually excluded. Reporting practice also varies between forces, and some records are amended after the initial report. A postcode showing zero collisions may simply have had none recorded, not none that happened. Treat the figures as a guide to relative risk between streets rather than a complete record.
How far back do local road safety data sources go?
The Department for Transport publishes collision datasets going back well over a decade, and police.uk holds several years of street-level records. Older years are useful for spotting a trend, such as a junction that repeatedly appears. Local highway authorities may hold longer internal records. Always check the last-updated date, since recent months are often provisional or incomplete.
How can I compare collision data between nearby streets?
Pick streets of similar character, then compare collision counts over the same period and normalise by traffic volume where figures allow. A busy through-road will usually show more collisions than a quiet cul-de-sac, so look at casualty rates rather than raw counts. A road safety map helps here, showing clusters at junctions and bends. Note the road type and speed limit for each street before drawing conclusions.