UK Footfall Data: What 24 Million Devices Actually Count
Compare the official ONS UK footfall index with industry monitors, understand what each figure actually counts, and pick the right source for your research.
The ONS publishes an official weekly and monthly UK retail footfall index built from BT Active Intelligence data covering around 24 million devices; it counts visitors to retail areas, excludes people who live or work there, and is indexed to a 2023 baseline. Industry monitors from BRC-Sensormatic and Ipsos use in-store sensors and their own baselines, so the series are not directly comparable.
In this guide
- Table of Contents
- Where to get UK footfall data: official datasets, industry monitors and APIs
- How the main UK footfall datasets differ in method and coverage
- How to read and apply footfall figures in your own research
- Recent UK footfall trends: a 2026 snapshot
- How retailers, landlords and analysts use footfall data
- How footfall data fits into local area research
- What the data actually tells you, and what it does not
- How NoFooly can help with postcode-level context
- FAQ
- Sources
- Recommended

For UK footfall data, start with the Office for National Statistics real-time indicators, which publishes an official weekly and monthly footfall index built from BT Active Intelligence network data. For industry commentary and forecasts, BRC-Sensormatic and Ipsos Retail Performance publish their own monitors. If you need site-level or hourly detail, look to commercial APIs or local sensor providers instead.
TL;DR:
- The ONS index uses anonymized data from 24 million devices and excludes retail area residents and workers, so it measures visitors rather than total movement.
- Because ONS uses a 2023 baseline while other providers may use different periods or raw counts, never combine their series without aligning methods.
- Researchers needing hourly or site level detail must use paid commercial feeds or local sensors; academic archives offer historical, not live, detail.
- Separate week to week changes from year over year trends, then pair footfall with sales data to measure conversion rather than visits alone.
- For property decisions, footfall indicates activity but says nothing about flood risk, crime, noise or local prices, so assess those factors separately.
Table of Contents
- Where to get UK footfall data: official datasets, industry monitors and APIs
- How the main UK footfall datasets differ in method and coverage
- How to read and apply footfall figures in your own research
- Recent UK footfall trends: a 2026 snapshot
- How retailers, landlords and analysts use footfall data
- How footfall data fits into local area research
- What the data actually tells you, and what it does not
- How NoFooly can help with postcode-level context
- FAQ
- Sources
Where to get UK footfall data: official datasets, industry monitors and APIs
The ONS real-time indicators bulletin is the starting point for most UK research. It draws on BT Active Intelligence, which aggregates anonymised EE network data, and publishes weekly and monthly indices broken down by location type and region. The underlying dataset is downloadable and updated on a regular release schedule, with documentation covering exactly what is counted.
Beyond the official series, three other sources matter for anyone building a fuller picture:
- BRC-Sensormatic Footfall Monitor: a long-running industry benchmark with monthly press summaries covering the whole UK and location-type splits.
- Ipsos Retail Performance: runs the Retail Traffic Index, a national index with regional breakdowns and forecasting “Weather Map” tools used for planning.
- CDRC footfall archives: academic datasets maintained for research use, useful for historical comparison rather than live monitoring.
- Commercial providers such as Statista: offer quick, chart-ready figures by location type, though much of the detail sits behind a paywall.
For a general research task, the ONS dataset covers most needs without a subscription.
How the main UK footfall datasets differ in method and coverage
The headline figures from each source are not directly comparable, and the differences matter more than they first appear.
- What gets counted: ONS data explicitly exclude people who live or work in a retail area, so the index reflects visitor movement rather than every device detected nearby.
- Sample scale and method: ONS figures draw on a mobile network covering 24 million devices, while BRC-Sensormatic relies on in-store sensor networks with a different kind of coverage bias toward participating retailers.
- Baseline and indexing: the ONS series runs on a 2023 baseline, while industry monitors often use their own base period or report absolute counts, so an index value of 95 means different things in different series.
- Time resolution: ONS publishes weekly and monthly aggregates, whereas some commercial APIs offer hourly or daily feeds for a fee.
Pro Tip: Never splice two footfall series from different providers into one time line without checking their baselines first, since a change in data supplier can look like a change in footfall when it is really a change in method.
How to read and apply footfall figures in your own research
Footfall figures only become useful once you know what the number is actually measuring and what to compare it against.
- Separate week-on-week from year-on-year movement: a short-term dip may reflect weather or a one-off event, while a sustained year-on-year change points to something structural.
- Pick the right breakdown for the task: location type (high street, retail park, shopping centre) matters for retail strategy, while regional splits matter more for property or investment research.
- Cross-check against a second source: compare the ONS index against BRC-Sensormatic or Ipsos figures for the same period to see whether a trend holds across methods.
- Align with transaction data where possible: footfall tells you how many people turned up, not how many bought anything, so pairing it with sales figures gives a fuller picture.
- Cite the source, date, baseline and any caveat: a figure quoted without its reference period or baseline is close to meaningless to anyone else reading your work.
Recent UK footfall trends: a 2026 snapshot
Industry monitors through late 2025 and into 2026 have reported a soft patch for UK footfall. BRC-Sensormatic figures show footfall falling as shoppers held back ahead of expected sales periods, with the decline uneven across location types. Shopping centres and high streets have tended to show the steeper falls in these updates, according to BRC commentary, while retail parks have generally held up better.
Regional variation also features regularly in these press updates, with England, Wales, Scotland and Northern Ireland each showing their own patterns from month to month. The drivers cited most often are the timing of sales events, weather, and broader pressure on household budgets, which tend to show up in the data before they show up anywhere else.

How retailers, landlords and analysts use footfall data
Footfall data earns its keep when it is tied to a specific decision rather than read as a headline number.
- Benchmarking: comparing a single store’s footfall against the regional or national index shows whether a slow week is local or market-wide.
- Staffing and marketing: weekly and monthly patterns help time rotas and promotions around when people actually show up.
- Conversion estimates: pairing footfall with till data gives a conversion rate, a far more useful figure than footfall alone.
- Site selection: footfall trends feed into negotiations over rent, though they are only one input among several, including rent levels, dwell time and competing units nearby.
How footfall data fits into local area research
Footfall is one more public data point you can read alongside flood risk, crime figures and sold prices when weighing up a postcode. A busy high street can mean good access to shops and transport, or it can mean noise and parking pressure, so we treat footfall as context rather than a verdict on its own. Our Area Report brings together flood, crime, noise, planning and price data and reads it against the brief a buyer actually gives us, which is where raw national statistics tend to fall short on their own.
What the data actually tells you, and what it does not

The most common mistake in reading UK footfall data is treating any single index as a complete picture of a place. The ONS series is the most rigorous and transparent source available, but it measures visitor movement on a retail-area basis, not neighbourhood character, safety or value. Industry monitors add useful texture on short-term retail trends, yet they are built for retailers watching their own stores, not for someone deciding whether a street suits their family.
The conventional advice, “check the footfall figures”, tends to stop short of the harder question: footfall for what purpose? A retailer sizing up a unit needs a very different read than a buyer wondering whether a street feels lively or just busy. Our view is that footfall data earns its place only when it is cross-checked against at least one other source and tied to a specific decision, never read in isolation as proof of anything. Start with the official ONS series for credibility, then ask what it leaves out before you act on it.
— Gracie C
How NoFooly can help with postcode-level context
National footfall data tells you how busy a type of place has been. It does not tell you whether a specific street near a specific postcode is noisy, flood-prone or what nearby homes actually sold for, which is where our reports come in.
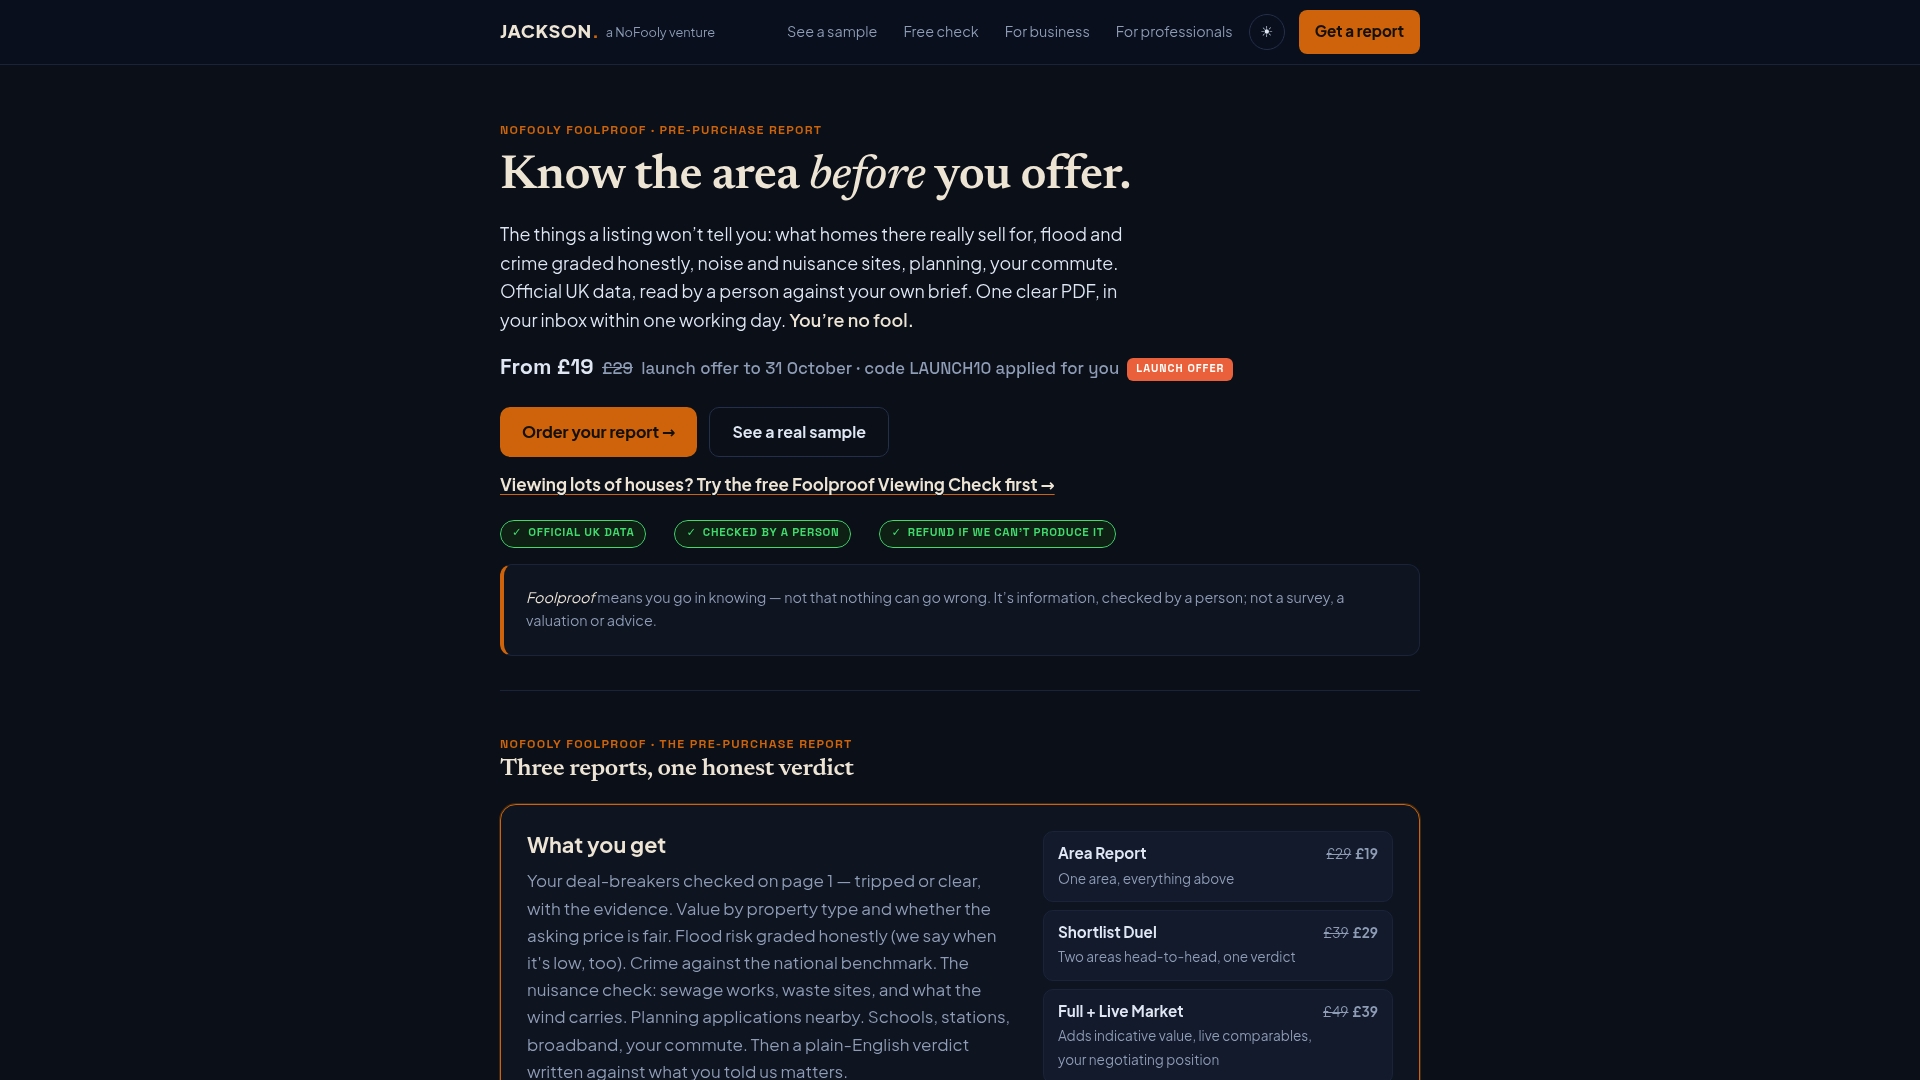
From £9, our Instant Report gives a plain-English PDF for any postcode in England & Wales within minutes: sold prices, planning applications next door, schools, flood detail, crime, noise and broadband. From £19, our Area Report is read by a named person against your own brief and deal-breakers, with a verdict written for your situation rather than a generic summary.
- Before a viewing: run a free Viewing Check to flag anything worth asking about on the day.
- Comparing two shortlisted streets: our Shortlist Duel puts two areas head to head on the same evidence.
Get your report at Jackson.
FAQ
What is the best source for UK footfall data?
The ONS real-time indicators are the most authoritative source, published with a clear methodology and downloadable dataset. For industry commentary and shorter-term retail trends, BRC-Sensormatic and Ipsos Retail Performance both publish regular monitors that complement the official figures.
How often is UK footfall data updated?
The ONS publishes its retail footfall dataset on a weekly and monthly cycle, alongside its wider real-time indicators bulletin. BRC-Sensormatic and Ipsos both release their own monitors on a broadly monthly schedule, usually with accompanying press commentary.
Does footfall data tell me if an area is a good place to buy a property?
Footfall data shows how many people pass through a location but says nothing about flood risk, crime, noise or whether the asking price looks fair against local sold prices. For that level of detail on a specific postcode, a person-checked Area Report brings together sold prices, planning and local risk data and reads them against your own brief.
Can I access hourly or site-level UK footfall data?
Hourly or site-specific footfall generally requires a commercial API or a local sensor provider, since the official ONS series is published weekly and monthly rather than in real time. Academic archives such as CDRC offer finer historical detail for research purposes, though not live hourly feeds.
Sources
Different providers count different things: ONS figures exclude residents and workers in retail areas, while in-store sensor networks like BRC-Sensormatic count everyone who passes a fitted sensor. Baselines also differ, with the ONS series indexed to 2023, so comparing raw numbers across sources without checking the method can be misleading.
- Economic activity and social change in the UK, real-time indicators: 18 June 2026
- Dataset: UK retail footfall
- Footfall falters as shoppers hold out for sales
- Retail Traffic Index | Ipsos Retail Performance
Recommended
Short on time? Let us run the checks for you
Viewing this weekend and don't fancy an afternoon of maps? The free Foolproof Viewing Check pulls the headline tiles for any address you're looking at — no card, no sign-up.
Want the whole area read by hand and written up, checked and signed off by a real person before it reaches you? That's the Jackson pre-purchase area report. Software does the legwork so it's quick and affordable; a person makes the call so you can trust it. Reports start from £19.