Traffic Congestion in Manchester: What Buyers Should Know
How bad is traffic congestion in Manchester, which roads suffer most, and how to test the commute before you buy a home in Greater Manchester.
Manchester drivers lost about 61 hours to congestion in 2024 according to INRIX, fourth among UK cities, and TomTom put average congestion at 48.1% in 2025. The worst delays sit on the M56 near Wythenshawe, the M60 ring and the A5103, mainly at weekday peaks. How much it affects you depends on your route and hours, so drive the real journey at the real time before offering.
In this guide
- TL;DR
- Table of Contents
- How bad is traffic in Manchester?
- Where congestion is worst
- When delays are most likely
- Why Manchester is so congested
- Our view: congestion is a postcode question
- How to test a commute before you offer
- Reading congestion rankings with care
- What congestion means for the area you choose
- Put a postcode through our checks
- FAQ
- Sources
- Recommended

Manchester is congested enough to matter when you choose where to live, but how much it matters depends on your route, your hours and your postcode. Drivers lost 61 hours to congestion in 2024, and the worst delays cluster on the M60, the M56 and the roads feeding them. Below we set out the numbers, the roads, the causes and a practical way to test a commute before you make an offer.
TL;DR
- INRIX reported that Manchester drivers lost 61 hours to congestion in 2024, up from 54 hours in 2023, which put the city fourth among UK cities in that analysis.
- The worst delays sit on the motorway ring and its approaches, especially the M56 near Wythenshawe, the M60 and the A5103.
- Congestion comes from a dense motorway network with close junctions, heavy freight and little room to widen anything.
- Rankings differ by measure and year, so test your own commute at your own hours rather than trusting one headline figure.
- Buses and trams are an alternative for some routes: Greater Manchester reported 82.7% of buses on time in January 2026.
Table of Contents
- How bad is traffic in Manchester?
- Where congestion is worst
- When delays are most likely
- Why Manchester is so congested
- Our view: congestion is a postcode question
- How to test a commute before you offer
- Reading congestion rankings with care
- What congestion means for the area you choose
- Put a postcode through our checks
- FAQ
- Sources
How bad is traffic in Manchester?
Bad enough to be measurable year after year, and worsening on several measures. INRIX’s analysis, reported in 2024 coverage of European congestion, found Manchester drivers lost 61 hours in congestion in 2024. That was 13% more than the 54 hours of 2023, and it placed Manchester fourth among UK cities in that analysis.
TomTom’s index tells a similar story. Its Manchester Traffic Index for 2025 reports an average congestion level of 48.1%, 1.6 percentage points higher than in 2024. Average highway speed was 41.8 km/h, which is 1.1 km/h slower than the year before.
The regional picture agrees. Greater Manchester Combined Authority’s March 2026 transport report says traffic volumes in the city region were 1.6% above 2019 pre-pandemic levels, and that traffic was increasing faster than the England and UK averages.
A quick translation into daily life. Sixty-one hours a year is not a figure you will feel as a single awful journey. It is the accumulated cost of slow peak-hour trips, spread across a year. For a buyer, the useful question is not “is Manchester congested?” (it is) but “how congested is the particular journey I will make every weekday?”
Where congestion is worst
The heaviest delays are on the motorway network around the south and west of the city, rather than in one single city-centre jam.
The M56, M60 and A5103
ManchesterWorld’s analysis of 2023 government delay data put the M56 between junctions 3 and 2 top of its list of the area’s most congested roads, at 41.8 seconds of delay per vehicle per mile. The M56 eastbound between junctions 1 and 2 recorded 31.1 seconds. The A5103 northbound within the M60 junction and the M56 westbound between junctions 1 and 2 each recorded 19.7 seconds.

The volume of traffic explains why. Manchester Evening News, using count-point data, reported 2019 average daily traffic of 174,693 vehicles between the M56 Wythenshawe Interchange and the A5103 Princess Road junction, and 155,198 on the adjacent airport-to-Wythenshawe section. The same analysis found the M56, M60 and A5103 accounted for the top 154 count points under its method, and that adding the A57(M) covered the top 400.
Those are older counts, so treat them as a guide to which roads carry the most vehicles, not as today’s flows.
The M60 and its junctions
The M60 is the ring that most Greater Manchester commuters touch at some point. A Department for Transport, Highways England and Transport for the North study of the north-west quadrant found that merging and diverging traffic from the M62, M602, M61 and M66 creates substantial congestion at M60 intersections. It also reported that most M60 sections between junctions 8 and 18 were in the worst 10% nationally for motorway journey-time reliability, and that peak speeds were below 15 mph on parts of the network.
That study is from 2016, and conditions have changed since. The point that has lasted is reliability: when one incident closes a lane, the alternative routes are already busy, so delays spread and linger.
Inside the city
TfGM travel advice, quoted in Christmas-shopping coverage, says the Mancunian Way typically has higher journey times on weekdays, while the northern Inner Ring Road around Great Ancoats Street is slower at weekends. That matters if you are weighing a flat in the centre against a house further out: the pattern of delay differs by day of the week.
When delays are most likely
Weekday peaks are the obvious pressure, but the calendar matters too. In that same TfGM advice, 3pm to 7pm was the busiest period over a comparable Christmas-shopping weekend, with peak journey times 11% higher than the previous year.
GMCA’s report adds that Christmas-market traffic raised Regional Centre flows by an average of 9% on weekdays and 12% at weekends, on a network already at or near capacity. If you are viewing a home in November or December, remember the roads will be busier than in a quiet month.
Three practical consequences for viewings:
- Visit at the time you would actually travel, not at a Saturday lunchtime when the roads are kind.
- See the area on a school-run morning as well as an evening, because a quiet-looking street can sit next to a queue.
- Try the route once in each direction, as delays are often lopsided.
Why Manchester is so congested
The causes are structural, which is why the problem does not disappear after a few roadworks end.
The north-west quadrant study attributes congestion to insufficient capacity, closely spaced junctions, narrow lanes, steep gradients, heavy freight and a mix of strategic, regional and local traffic using the same roads. GMCA’s more recent report says the motorway network directly affects congestion, bus reliability and the resilience of local roads, because Greater Manchester has high junction density, short weaving sections, radial roads feeding motorway junctions and limited scope for expansion.
In plain terms: lots of junctions close together, lots of different journeys sharing the same lanes, and nowhere to build more road. When traffic is heavy, a single breakdown can turn into a long tailback.
There is some management in the system. GMCA reports that more than half of the roughly 1,400 traffic signals in Greater Manchester use adaptive control, with bus priority at more than 250 junctions and tram priority where Metrolink crosses roads. That helps buses and trams keep to time, though it does not remove the underlying volume.
Our view: congestion is a postcode question
We read area data all day, and the same mistake keeps appearing: buyers treat congestion as a city-wide fact when it is a street-by-street and hour-by-hour one.
Two homes in the same borough can have completely different mornings. One is a ten-minute walk from a tram stop that skips the queues. The other sits two junctions from a motorway slip road that backs up at 8am. A city league table cannot tell you which is which.
That is why our reports start from the postcode and, from the Area Report (from £19), from your own written brief. If your deal-breaker is a 40-minute door-to-door commute, the verdict is written against that, not against a generic ranking. We show the evidence and hedge what is uncertain. You decide, and you are no fool.
Gracie C
How to test a commute before you offer
Use a simple routine. It costs very little and catches many of the nasty surprises.
- Write down your real journeys. Work, school, a parent’s house, the gym. Note the day and hour for each.
- Plan them by public transport. The Bee Network app can plan public-transport and active-travel journeys, show expected arrival times and offer Park and Ride options.
- Drive them for real. Do the route at the hour you would travel, on a normal weekday and once outside school holidays if you can.
- Check the alternatives. If the motorway is your only sensible route, ask what happens when it is blocked. The research above suggests alternatives are often congested too.
- Count the whole trip. Parking, the walk to the station and the last mile add up. Our guide to ways to evaluate commute times from a new property covers this in more detail.
Public transport is not a cure-all, but it has been improving on one measure. GMCA reported 82.7% of buses on time in January 2026, up from 71.9% in January 2025, and Metrolink carried 46.3 million journeys in the latest 12-month period it reported.
Checking live conditions
The same Bee Network app gives live departures, bus locations and alerts for roads, transport and major incidents, so it doubles as a daily tool once you have moved. TfGM’s own advice is to check your route before every journey, which is sound whether you drive or ride.
Checking how busy a particular road is
Department for Transport count-point pages give annual average daily flow and a breakdown by vehicle class for individual points on the network. They are worth a look if you are considering a house on a main road or near a junction. Bear in mind that some count points use manual counts and others use estimates carried forward from the previous year.
Reading congestion rankings with care
Headlines such as “third most congested city” or “fourth in the UK” are fair as far as they go, but they are not interchangeable. The Department for Transport’s background quality report explains that congestion statistics use more than one measure, including average vehicle speed and average delay compared with free-flow conditions. Rankings can therefore differ by metric, area and time period. The same report notes that Strategic Road Network and local A-road statistics are not directly comparable, and that local A-road data has a series break from April 2025.
For context, the DfT’s latest Strategic Road Network statistics estimate national delay at 10.9 seconds per vehicle per mile for the year ending March 2026, down 7.6% on the year before. Compare that with the 2023 Manchester figures of 41.8 seconds on the worst M56 stretch, but do so loosely: the Manchester figures come from a different year and a media analysis of the data, so they show scale rather than a precise gap.
Three habits protect you from over-reading any figure:
- Check the year. A 2016 study and a 2025 index describe different roads.
- Check the measure. Hours lost, percentage congestion and seconds of delay are not the same thing.
- Check the geography. A city-wide number says little about your street.
What congestion means for the area you choose
It changes the price of a place in time and stress rather than pounds. A home near a tram or rail line may suit someone who works in the centre. A home near a motorway junction may be quick at 6am and slow at 8am. A quieter suburb may add 20 minutes to a journey that looked short on a map.

It also interacts with other things you should weigh at the same time: air quality, noise, schools and what is being built next door. Our Manchester area guide puts prices, broadband, air and crime side by side. If you are comparing boroughs, the Trafford and Stockport guides are good places to start. Buyers who care about air near busy roads can look at the cleanest air in Greater Manchester, and our piece on living near a busy high street covers a related trade-off.
For the money side, the Greater Manchester in six numbers piece compares councils, while the most affordable homes and fastest-rising prices tables show where value and momentum sit. Cheaper areas often come with longer commutes, so read them together.
Put a postcode through our checks
We built NoFooly for the moment before you offer. Our free Viewing Check gives you a first look at a place. The £9 Instant Report is generated from the postcode and checked by a review agent, not read by a person, and arrives as a PDF in minutes. It covers sold prices, planning next door, schools, flood detail, crime, noise, nuisance sites, broadband and commute, with a plain-English verdict.
If commute is your deal-breaker, the Area Report (from £19) is read by a named person against your written brief, and adds the commute door to door, the house's sale history and tenure, and an indicative read on whether the asking price looks fair against local evidence. You get a PDF within one working day. The Shortlist Duel compares two areas head to head, and the Full + Live Market tier adds an indicative, orientation-only market estimate, live comparables and negotiating position.
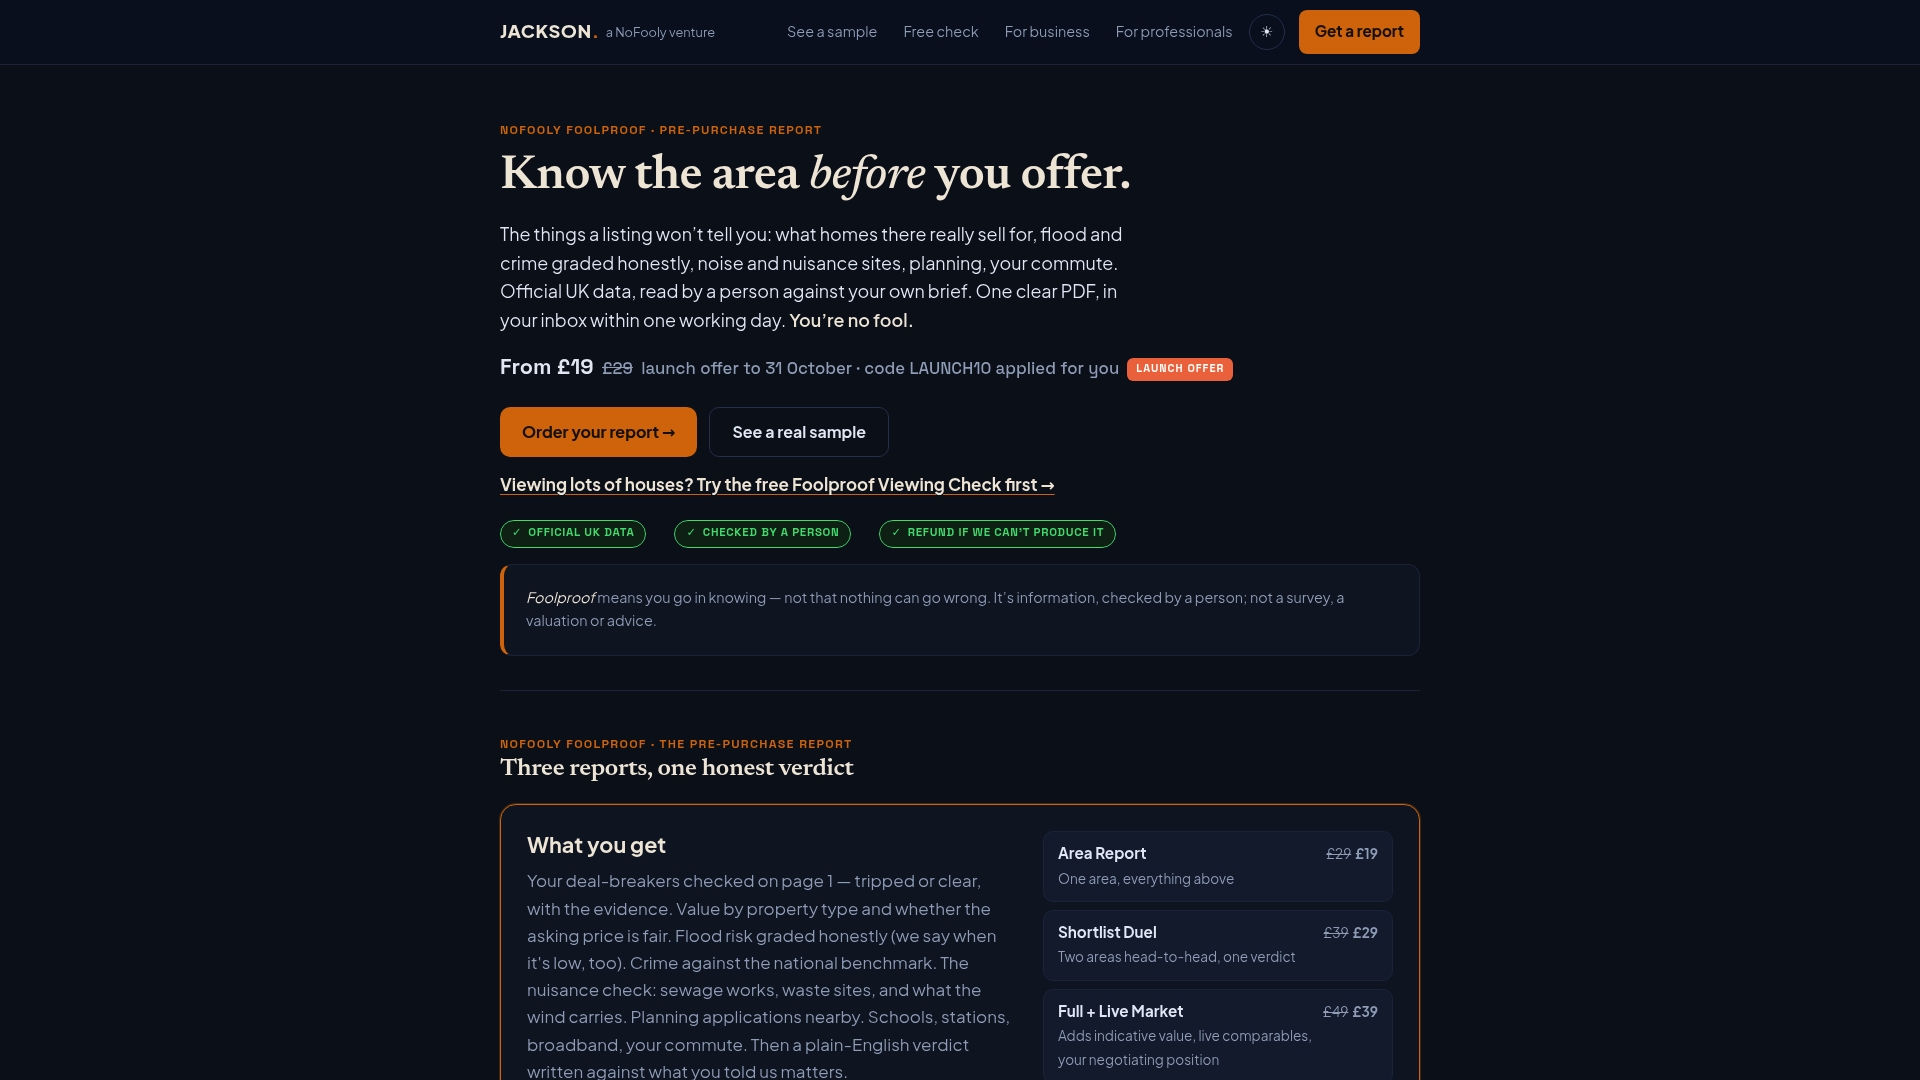
These reports cover England and Wales only. They are not a survey, do not check building condition, and are not financial, legal or mortgage advice. You can start from the NoFooly homepage and enter the postcode you are considering.
FAQ
Is Manchester the most congested city in the UK?
No. INRIX’s analysis put Manchester fourth among UK cities for 2024, with 61 hours lost per driver. A separate report cited in local coverage called it the UK’s third most congested city the previous Christmas. The order moves with the measure and the year, so use it as a guide only.
Which roads are worst for delays?
In the 2023 government delay data analysed by ManchesterWorld, the M56 between junctions 3 and 2 came top, at 41.8 seconds of delay per vehicle per mile. The M60, A5103 and other M56 sections also featured. Check the latest figures on the Department for Transport’s pages for any road you plan to use.
What time is Manchester traffic worst?
Weekday peaks are the usual pressure, and the Mancunian Way tends to be slower on weekdays. The northern Inner Ring Road near Great Ancoats Street tends to be slower at weekends, according to TfGM advice. Around Christmas, the afternoon to early evening has been the busiest spell.
How can I check traffic before choosing an area?
Plan your real journeys in the Bee Network app, drive the route at your travel hour, and look at Department for Transport count points for any main road near the property. A NoFooly Area Report adds the commute door to door against your own brief.
Does congestion affect house prices?
We cannot give you a rule that holds for every street, and we do not tell you what a property is worth as fact. Commute time is one factor buyers weigh among many. Comparing sold prices and local evidence for the specific postcode is a better test than any city-wide claim.
Sources
- INRIX congestion analysis, reported by KentOnline
- TomTom Traffic Index: Manchester
- GMCA: Delivering Transport for a Global City Region, March 2026
- ManchesterWorld: the 20 most congested roads in and around Manchester
- Manchester Evening News: Manchester’s worst-ever roads for traffic and pollution
- The Manc: travel advice for Christmas shopping weekend
- Manchester North-West Quadrant Study, Stage 3 Report
- Bee Network app, TfGM
- DfT travel time statistics background quality report
- DfT travel time measures for the Strategic Road Network, April 2025 to March 2026
- DfT road traffic statistics: count point 7950
Recommended
Short on time? Let us run the checks for you
Viewing this weekend and don't fancy an afternoon of maps? The free Foolproof Viewing Check pulls the headline tiles for any address you're looking at — no card, no sign-up.
Want the whole area read by hand and written up, checked and signed off by a real person before it reaches you? That's the Jackson pre-purchase area report. Software does the legwork so it's quick and affordable; a person makes the call so you can trust it. Reports start from £19.