How to Find Crime Trends by Postcode (England & Wales)
How to find crime trends by postcode in England & Wales using police.uk: read the map, track months, adjust for population and compare like with like.
Go to police.uk, enter the postcode and open the crime map; it shows recorded crimes by type for each month, with a year of history you can step through. Count incidents by category across several months, divide by the area's population (ONS census figures) to get crimes per 1,000 residents, and compare with similar postcodes or the local force average rather than raw totals.
In this post
- Table of Contents
- Why Crime Trends Matter When Assessing a Postcode
- Using the Police.uk Crime Map to Find Crime Data
- Tracking Crime Trends Over Time
- How to Compare Crime Rates Between Areas
- Understanding Crime Map Data Limitations
- Combining Crime Data With Other Area Checks
- Common Mistakes When Interpreting Crime Trends
- Frequently Asked Questions
Table of Contents
- Why Crime Trends Matter When Assessing a Postcode
- Using the Police.uk Crime Map to Find Crime Data
- Tracking Crime Trends Over Time
- How to Compare Crime Rates Between Areas
- Understanding Crime Map Data Limitations
- Combining Crime Data With Other Area Checks
- Common Mistakes When Interpreting Crime Trends
- Frequently Asked Questions
Last Updated: 12 October 2026
Why Crime Trends Matter When Assessing a Postcode
Understanding crime trends by postcode is essential when you're considering a move or investment. Crime data tells you what actually happens in an area, not what estate agents hope you'll believe. It's one of the few publicly available metrics that cuts through marketing language and gives you facts.
At JACKSON, we provide plain-English area reports for any postcode in England and Wales, pulling together official data that is often left out of property listings. It gives homebuyers, property investors and property professionals the data to go in knowing about area issues like flood, crime or noise.
Crime trends matter because they change. A neighbourhood that was quiet five years ago might have shifted. Conversely, areas with historically higher crime sometimes improve. The data shows you the direction of travel, not just a snapshot.
The challenge is knowing where to look and how to read what you find. The official sources exist. They're free. But they're not always intuitive. This guide walks you through finding and interpreting crime trends by postcode using the tools available to you.
Using the Police.uk Crime Map to Find Crime Data
The police.uk crime map is your primary source for recorded crime by postcode. It's maintained by the Home Office and shows incidents recorded by police forces across England, Wales and Northern Ireland (JACKSON's reports cover England and Wales only).
Entering your postcode and reading the results
Start by visiting police.uk and navigating to their crime map tool. Enter your postcode in the search box. The map will load with your area highlighted and a list of crimes recorded in that postcode over the last month.
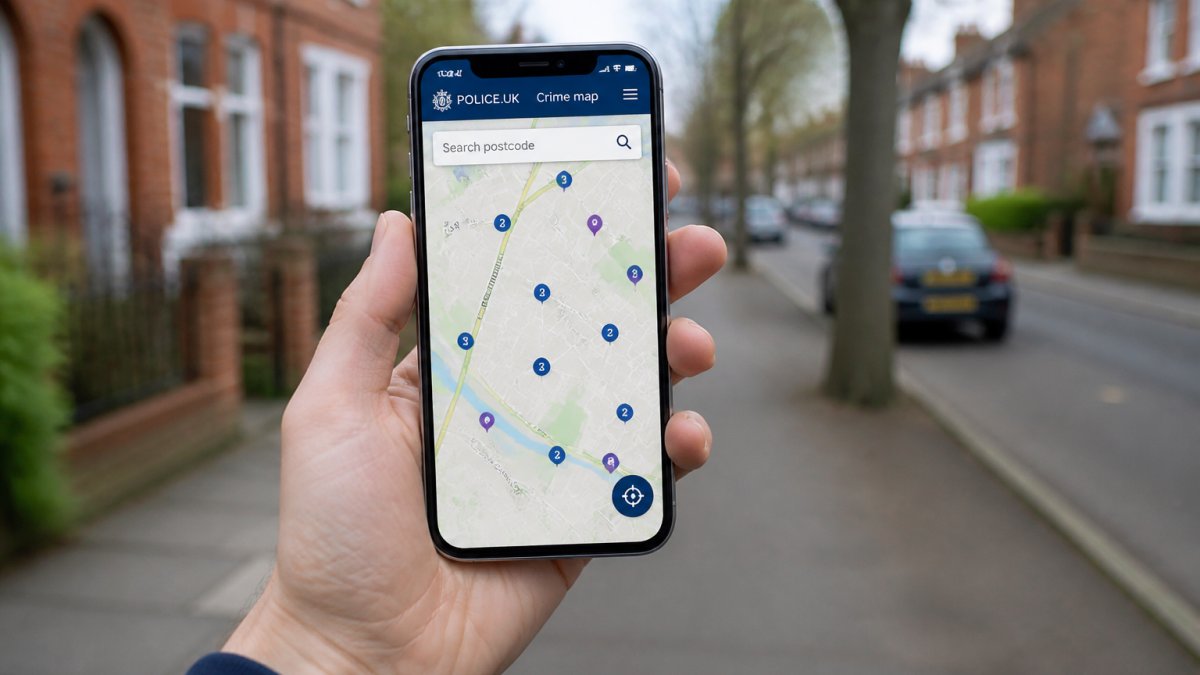
The results show individual incidents plotted on the map. Each marker represents a reported crime. You'll see the crime type, the date it was recorded, and sometimes a brief description. The data is typically updated monthly, so you're looking at the most recent month's activity.
Read the crime list carefully. You're looking for patterns, not isolated incidents. A single theft is noise. Five thefts in one week across a small postcode suggests something worth noting.
The map view helps you see whether crime clusters in specific streets or spreads across the area. This matters because postcodes can be large. A crime might be on the far edge of your postcode, nowhere near the property you're interested in.
Understanding crime categories and incident counts
Police.uk groups crimes into categories: violence, burglary, robbery, theft, anti-social behaviour, drugs, and others. Each category tells a different story.
Violence against the person includes assault and harassment. High numbers here are worth a closer look. Burglary and robbery point to property crime risk. Theft and shoplifting are common in busy town centres and less concerning in residential areas. Antisocial behaviour covers noise complaints, rowdy gatherings, and similar issues.
The incident count matters more than you might think. A postcode with 30 crimes in a month tells you something very different from one with three. But context is crucial. A busy town centre postcode might naturally have higher numbers than a quiet village. You need to compare like with like.
Police.uk doesn't always provide the raw numbers in an easy summary. You'll need to count the incidents listed, or use the Home Office crime statistics portal to access aggregated figures by police force area and crime type.
Tracking Crime Trends Over Time
A single month's data is a snapshot. Trends reveal whether an area is getting safer or less safe.
Accessing historical data and monthly reports
Police.uk allows you to view data from previous months. At the top of the crime map, you can select a date range. This lets you pull up the same postcode for different months and compare.
Many people check only the current month. That's a mistake. An area with a spike in one month might be returning to normal. Or it might be the start of a pattern. Three months of data gives you a clearer picture than one.
The Office for National Statistics crime survey publishes quarterly and annual crime trends. These show whether crime nationally is rising or falling, and how different regions compare. Local police forces also publish annual reports that break down crime by area.
Spotting patterns and seasonal changes
Crime isn't random. Some types spike in winter (burglary increases when nights are long and homes are dark). Others peak in summer (street crime, antisocial behaviour). If you're checking data in November, compare it to November in previous years, not to August.
Look for the direction. Is the postcode's crime rate climbing month on month? Dropping? Flat? A climbing trend matters more than a high single month. It suggests something is changing for the worse.
Also note whether specific crime types are rising. A postcode with stable overall crime but rising violence is different from one with stable overall crime and falling violence. The composition of crime matters as much as the total.
How to Compare Crime Rates Between Areas
Comparing one postcode to another requires care. Raw numbers mislead because postcodes vary wildly in size and population density.
Using crime density and per-capita figures
A postcode with 50 crimes might sound worse than one with 20. But if the first postcode contains 5,000 residents and the second contains 500, the second is actually much worse in per-capita terms.
Police.uk doesn't always give you population figures for each postcode. You can find these from the Office for National Statistics postcode lookup, which provides census data. Divide the number of crimes by the population, then multiply by 1,000 to get crimes per 1,000 residents. This lets you compare fairly.
Alternatively, compare each postcode to its local police force's average. Most police forces publish area-level crime statistics. If your postcode is above the local average, it's worse than the surrounding area. Below average, it's better.
Setting realistic expectations for different neighbourhood types
A city centre postcode will always have more crime than a rural one. That's not a flaw in the data. It's how density works. Don't reject a city postcode because it has higher crime numbers than a village postcode. Compare it to other city centre postcodes instead.
Similarly, postcodes near transport hubs, nightlife districts, or major shopping areas naturally see more crime. That doesn't mean they're unsafe for residents. It means they're busy, and busy places attract more incidents.
Residential postcodes should be compared to other residential postcodes. Student areas to student areas. Industrial areas to industrial areas.
Understanding Crime Map Data Limitations
The police.uk crime map is valuable. It's also incomplete. Understanding what it doesn't show is as important as understanding what it does.
What the data covers and what it doesn't
Police.uk shows only reported crimes. Unreported crime doesn't appear. If a crime happens but the victim doesn't report it, it's invisible to the map. This is particularly true for certain types of crime: some assaults, sexual offences, and theft from individuals go unreported at higher rates than property crime.
The map also lags behind real time. Data is typically one or two months old. A crime spike you see on the map might already be resolved. Conversely, a quiet month might not stay quiet.
Police.uk doesn't show where crimes are prevented or where police activity is concentrated. A postcode with high police presence might show lower crime partly because of that presence, not because it's inherently safer. You can't see this in the data.
The map doesn't distinguish between a crime that happened at a business address and one that happened at a home. A postcode with a major shopping centre will show retail theft. That's not relevant to your safety as a resident.
Why reported crime isn't the same as actual crime
Reported crime is what police record. Actual crime is broader. The gap between them varies by crime type and by area. In affluent areas, residents might report crime more readily. In less affluent areas, trust in police might be lower, so reporting rates drop.
This means you can't assume that a postcode with low reported crime is actually the safest. It might be. Or residents might simply report less often.
Similarly, a postcode with high reported crime might reflect an active community reporting issues, or it might reflect genuine crime problems. The data alone doesn't tell you which.
Combining Crime Data With Other Area Checks
Crime is one factor among several. JACKSON's area reports combine crime data with flood risk, noise, planning activity, and sold prices. Crime trends by postcode sit alongside other evidence.
A postcode with rising crime but improving sold prices might be gentrifying. One with stable crime but deteriorating prices might have other issues: poor transport links, noise, or environmental concerns.
Don't make decisions on crime data alone. Use it as part of a broader picture. If you're seriously interested in a property, combine police.uk data with council planning records, local news, and visits to the area at different times of day and night.
Common Mistakes When Interpreting Crime Trends
Most people make the same errors when reading crime data. Knowing them helps you avoid them.
Comparing postcodes of different sizes. A postcode with 100 crimes sounds worse than one with 30, until you learn the first has 20,000 residents and the second has 500. Always adjust for population.
Focusing on a single month. One bad month doesn't make an area dangerous. Three months of rising crime does. Look for trends, not spikes.
Ignoring crime type. A postcode with high shoplifting might be perfectly safe for residents. One with high robbery is riskier. The category matters.
Assuming police.uk is complete. It's not. Unreported crime, crimes at specific businesses, and historical patterns aren't visible. Use it as a starting point, not a final answer.
Forgetting context. A city centre will always have more crime than a village. Compare like to like, or you'll reject every urban postcode unfairly.
Crime trends by postcode give you real data about what actually happens in an area. But the data requires careful reading. Police.uk is free and official, but it's not intuitive. Many people check it once and miss the nuances.
At JACKSON, our area reports combine crime trends with flood risk, noise levels, planning activity, and sold prices. We provide plain-English area reports for any postcode in England and Wales, pulling together official data that is often left out of property listings. It is data, not advice, and not a survey.
Frequently Asked Questions
How can I check crime rates by postcode using police.uk?
Visit police.uk, enter your postcode in the search box, and the crime map will display incidents reported in that area for the last 12 months. The map shows individual crimes colour-coded by type, with a summary table listing counts for each category. You can zoom in and out to see crimes at street level or across a wider area. The data updates monthly, usually within the first week of each month.
Can I see crime trends over time for a specific postcode?
Yes. Police.uk shows 12 months of historical data by default. To track longer-term trends, you can manually record the monthly figures or use the downloadable data available from your local police force's website. Some forces publish annual crime reports. However, the police.uk interface itself displays only the most recent 12 months, so tracking trends beyond that requires external record-keeping or accessing published force reports directly.
What are the main limitations of crime map data?
Crime maps show only reported and recorded crimes, not unreported incidents. Crimes are plotted at street level for privacy, not exact addresses. Some forces may have different recording practices, affecting comparability. Anti-social behaviour and some minor offences may not appear. Maps don't explain context, such as whether a crime occurred in a commercial area, on public transport, or a residential street. They're a snapshot of reported crime, not a complete picture of safety.
How do I compare crime rates fairly between two different postcodes?
Check both areas on police.uk and note the total number of crimes and the breakdown by type. However, raw numbers can be misleading if one area has a larger population. Look for crime density (crimes per 1,000 residents if available from local authority data) rather than absolute figures. Also consider the postcode size: a city-centre postcode with thousands of residents will naturally show more crime than a rural one. Compare like with like, urban areas with urban areas, residential with residential.
Short on time? Let us run the checks for you
Viewing this weekend and don't fancy an afternoon of maps? The free Foolproof Viewing Check pulls the headline tiles for any address you're looking at — no card, no sign-up.
Want the whole area read by hand and written up, checked and signed off by a real person before it reaches you? That's the Jackson pre-purchase area report. Software does the legwork so it's quick and affordable; a person makes the call so you can trust it. Reports start from £19.
Frequently asked questions
How can I check crime rates by postcode using police.uk?
Visit police.uk, enter your postcode in the search box, and the crime map will display incidents reported in that area for the last 12 months. The map shows individual crimes colour-coded by type, with a summary table listing counts for each category. You can zoom in and out to see crimes at street level or across a wider area. The data updates monthly, usually within the first week of each month.
Can I see crime trends over time for a specific postcode?
Yes. Police.uk shows 12 months of historical data by default. To track longer-term trends, you can manually record the monthly figures or use the downloadable data available from your local police force's website. Some forces publish annual crime reports. However, the police.uk interface itself displays only the most recent 12 months, so tracking trends beyond that requires external record-keeping or accessing published force reports directly.
What are the main limitations of crime map data?
Crime maps show only reported and recorded crimes, not unreported incidents. Crimes are plotted at street level for privacy, not exact addresses. Some forces may have different recording practices, affecting comparability. Anti-social behaviour and some minor offences may not appear. Maps don't explain context, such as whether a crime occurred in a commercial area, on public transport, or a residential street. They're a snapshot of reported crime, not a complete picture of safety.
How do I compare crime rates fairly between two different postcodes?
Check both areas on police.uk and note the total number of crimes and the breakdown by type. However, raw numbers can be misleading if one area has a larger population. Look for crime density (crimes per 1,000 residents if available from local authority data) rather than absolute figures. Also consider the postcode size: a city-centre postcode with thousands of residents will naturally show more crime than a rural one. Compare like with like—urban areas with urban areas, residential with residential.